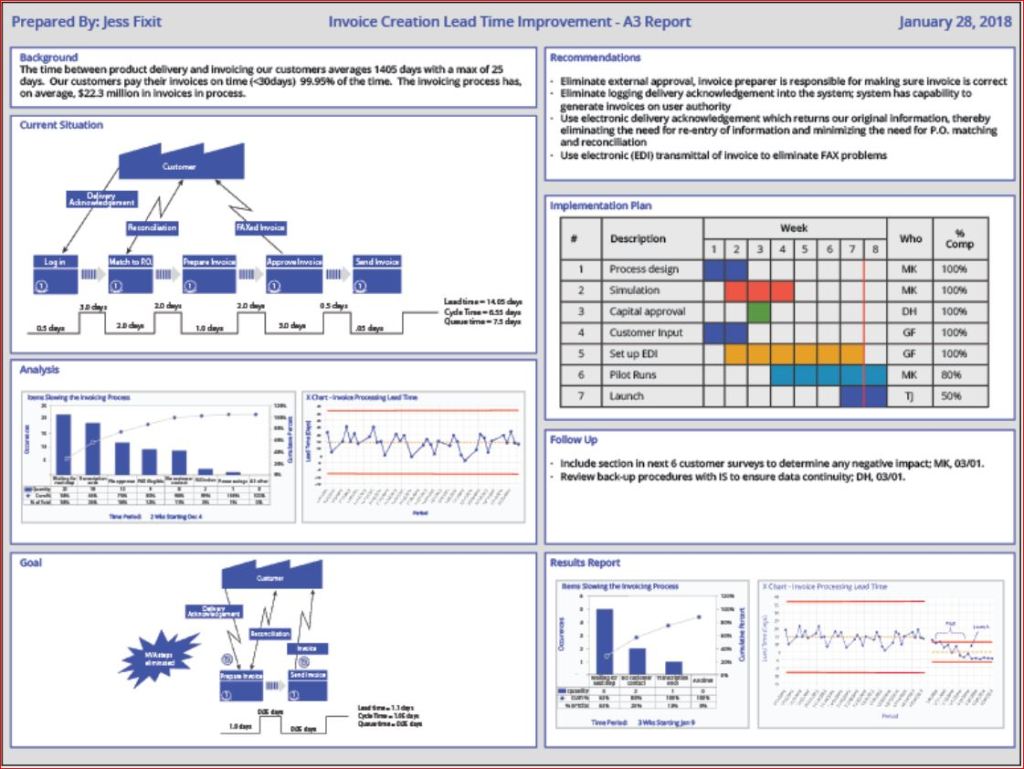
What is an A-3 Report?

REFLECTION: FOR STUDENTS: “Having no problems is the biggest problem of all.”- Taiichi Ohno
FOR ACADEMICS: “Data is of course important in manufacturing, but I place the greatest emphasis on facts.”- Taiichi Ohno
FOR PROFESSIONALS/PRACTITIONERS: “Make your workplace into showcase that can be understood by everyone at a glance.”- Taiichi Ohno
Foundation
The A3 Report is a model developed and used by Toyota and currently used by many businesses around the world. The A3 Report is named for a paper size-A3 (29.7 x 42.0cm, 11.69 x 16.53 inches). The entire current state and PDCA aspects of the project are captured visually for easy communication and reference. When CIP projects use an A3 methodology to track projects, it has been demonstrated that clear visual communication helps the team members and the overall organization be more aware of the team’s progress.
A minor improvement event, in my experience, is generally four weeks to six weeks. Still, when an issue needs to be addressed thoroughly, the organization must be willing to invest more time and resources. Almost every moment of improvement time spent may be wasted if the true root cause is not adequately addressed due to failure to properly invest resources. There are four distinct phases: 1) preparation and training; 2) process mapping and current state analysis; 3) process mapping and future state analysis; and 4) implementation and ownership. I will put up a basic template below and walk through the A3 report.
Example

- Clarify the Problem
- IS/IS Not Analysis-excellent first tool to use to define the scope of the problem.
- After the scope of the problem has been defined, define the problem relative to the organization or process. The focus should always be on an underlying process or systematic issue, not an individual failure. Systematic failures are frequent but can be corrected with teamwork. The problem statement should never include a suggestion for a solution.
- Breakdown the Problem
- Clearly define the problem in terms of the 5 Why’s and 2 W’s (Who?, What?, When?, Where?, Why? And How?, How much or often?
- Set goals for improvement towards the ideal state vs current state
- Team sets S.M.A.R.T. goals relevant to block 1 state, establishing the end improvement target
- Root Cause Analysis
- Team uses focus areas from block 2 to determine Root Cause(s) employing relevant RCA tools
- Common RCA tools
- Cause-Effect/Fishbone Diagram
- 5 Why Analysis
- Fault Tree Analysis
- Pareto Chart
- Clearly state the determined root cause(s) and display the output of the tools
- Develop Countermeasures
- The team should take the root cause/causes from Block 4 and assign specific countermeasures.
- Countermeasures should directly address the root cause and, in theory, should solve the problem identified in Block 1.
- The completed fifth block is populated with any tool that will outline the countermeasures.
- Implement Countermeasures
- The team tracks the countermeasures from Block 5 and ensures each one is accomplished.
- The completed sixth block should be populated with the tool used in Block 5 to outline the countermeasures and updated as each is accomplished.
- Monitor Results and Process
- Effectiveness Check of Countermeasures
- Before/After Analysis
- SPC Control Charts
- Use Data from block 1 to determine if countermeasures from block 5 are having the desired effect relative to the target.
- If countermeasures are not effective, go back to RCA-block 4 (PDCA) and reconvene.
- Use the tool from block 6 to track countermeasure as ineffective in Block 7
- Effectiveness Check of Countermeasures
- Standardize successful processes
- If countermeasures are effective-
- Standardize all successful processes and note successful countermeasures as Standardized as they are approved using the tool from block 6 in Block 7
- A separate block can be used for Standardized processes
- If countermeasures are effective-
Conclusion
A complete A3 report can use many different tools, depending upon the problem being examined, so don’t fall into the habit of always using the exact same format. Be certain all four phases are completed. Innovation comes from creativity, so leave behind SOPs that demand exact clones of past reports. You may be dealing with a problem no person in your organization has yet to encounter, so outside of the box is thinking should always be on the table (Not locked away in a closed mind)

Processing…
Success! You're on the list.
Whoops! There was an error and we couldn't process your subscription. Please reload the page and try again.


Bibliography
Quality Management Journal, Volume 16, 2009 – Issue 4
Published Online: 21 Nov 2017
Quality Progress Volume 49, 2009 – Issue 1
Jan 2016

8D vs PDCA & DMAIC
REFLECTION: FOR STUDENTS: Are you using critical thinking or using a paint by the numbers method to solve problems?
FOR ACADEMICS: Are you providing your students with the tools needed to distinguish between “guidelines” and mandates?
FOR PROFESSIONALS/PRACTITIONERS: Is your organization allowing you find the true root cause of an issue or forcing you to fill out a form within a certain time frame? Try to convince top management to allow teams to properly explore root causes, and if management continues to violate standards by ignoring the concept of due diligence in favor of meeting the closure rate when more time should have been allotted- file a CAPA. It is your duty as a Quality Professional.
What is 8D?
I have been performing CAPAs for many years. I have employed many methods: The Tried and True PDCA, the DMAIC approach, and even utilized the A3 path when the visual display of ongoing CAPAs was critical to communication (or mandated by policy). The Eight Discipline (8D) Approach has been the path that was least used by me, as it was (to me) least flexible. For those who are proponents, it works fine, but it seems more about CAPA closure by the numbers and documentation than it is about teaching your team to be independent critical problem solvers. While 8D will work well in any industry if implemented correctly, 8D is more template-based than PDCA. Have no doubt, DMAIC is quickly becoming template-like via software applications. A basic template is a useful guide, but the less controlled the problem solving, the more likely the team is to arrive at an innovative solution.
For those who are unsure what the Eight Disciplines are, let me elaborate on the Eight Disciplines:
Originally Ford developed the 8D method in the late 80s, and it spread to most of the automotive industry.
The Ds in this method are not acronyms (as many seem to struggle with), but rather a set of “Disciplines” to follow for problem-solving. These Disciplines were widely transferred to “forms” that became “8D Forms”, used for root cause analysis and correction of problems with unknown causes.
8D Method
- D0- Plan for solving the problem and determine resources needed
- Before 8D analysis begins, proper planning will always translate to a better start.
- SME Input
- Collect data on issues
- Identify any need for an Emergency Response Action (ERA)
- D1-Use a Team
- Choose the right type of team, right team members
- Teams require proper preparation.
- Set the ground rules
- 8D must always have two key members: a Leader and a Champion / Sponsor
- D2- Define and Describe the problem
- Specify by identifying in quantifiable terms the who, what, where, when, why, how, and how many (5W2H)
- 5 Why or Repeated Why (Inductive tool)
- Problem Statement
- Affinity Diagram (Deductive tool)
- Fishbone/Ishikawa Diagram (Deductive tool)
- Is / Is Not (Inductive tool)
- Problem Description
- D3- Develop interim containment plan
- Implement Interim Containment Actions (ICA)
- Verification of effectiveness of the ICA is always recommended to prevent any escapes to customers
- D4- Determine, identify, and verify root causes and escape points
- Comparative Analysis listing differences and changes between “Is” and “Is Not”
- Development of Root Cause Theories based on remaining items
- 5 Whys
- C&E Diagrams
- Determine Escape Point, which is the closest point in the process where the root cause could have been found but was not
- Review Process Flow Diagram for location of the root cause
- D5- Choose Permanent Corrective Action (PCA)
- Establish the Acceptance Criteria which include Mandatory Requirements and Wants
- Perform a Risk Assessment / Failure Mode and Effects Analysis (FMEA) on the PCA choices
- Based on risk assessment, make a balanced choice for PCA
- Select control-point improvement for the Escape Point
- Verify the PCA will resolve root cause of problem and any escape points issues
- D6- Implement and Validate PCAs for problem/nonconformity
- Define and Implement the best PCAs
- Validate PCAs using objective measurement
- D7- Prevent recurrence
- Review Similar Products and Processes for problem prevention
- Develop / Update Procedures and Work Instructions for Systems Prevention
- Capture Standard Work / Practice and reuse
- Assure FMEA updates have been completed
- Assure Control Plans have been updated
- Preserve and share the knowledge, preventing problems on similar products, processes, locations or families
- D8- Congratulate your team
- Archive the 8D Documents for future reference
- Document Lessons Learned on how to make problem-solving better
- Before and After Comparison of issue
- Celebrate Successful Completion
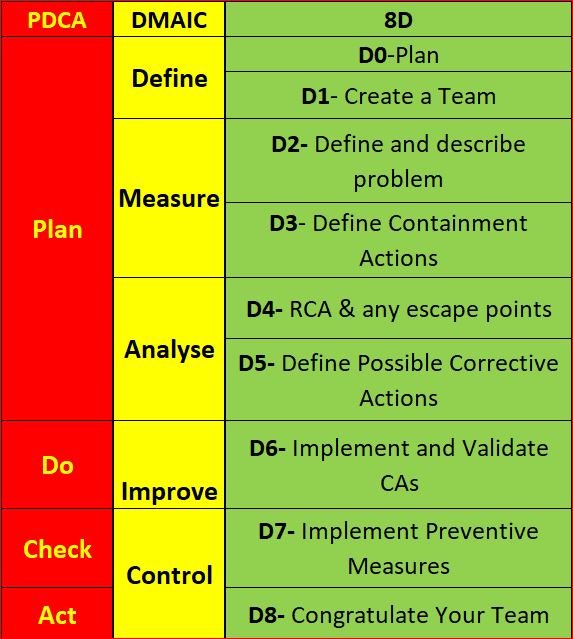
If you have interacted with a Six Sigma Team or a PDCA Root cause team, you know how the DMAIC and PDCA compares. For illustration, I have them side by side. 8D is much more broken down than the others. Using PDCA, the assumption is that a team acting in a PDCA cycle will have top management support and that those involved have the proper knowledge and training required to gather and analyze data to determine a solution. Also assumed is that the resources are available to improve the issue, Measurement of the results is always part of the cycle, and reacting to the final results of the Check on the improvement will yield either a successful CA/Improvement or begin a repeat of the cycle (basically the scientific method).
Most consider DMAIC the same as PDCA, just more focused on clarifying the PDCA cycle in order to reduce iterations by shifting the focus away from potential multiple cycles to achieving the most effective improvement the first time (though failure is still built into the process). The 8D method is once again pretty much the same process, as you can see.
When DMAIC and 8D are highly templated, a lot of the focus moves from solving the root cause toward closing the CAPA within the mandated time.
Making problem-solving quick and easy makes it easy to pencil whip. I would suggest you avoid the potential pencil whip methods. Have a group that must think for themselves and writes the report using only basic guidelines (not templates).
Conclusion
While I have clearly indicated I am not a fan of 8D and not happy with the way DMAIC is being pushed into templates, I do not mean to say that any single technique is better than another. Essentially, they are all the same method, re-focused. 8D is very conducive to utilizing documentation of project results and assigning work breakdown structure accountabilities (WBS) DMAIC is better for cross-functional communication and can be used for similar documentation. The Shewhart PDCA cycle is more of a high-level outline that allows the improvement project to be adjusted as required by SMEs. Choose the method that suits your needs, and as long as a cross-functional team performs proper due diligence with full top management support, the outcome will usually be similar regardless of the method chosen.
Processing…
Success! You're on the list.
Whoops! There was an error and we couldn't process your subscription. Please reload the page and try again.
Bibliography
ASQ. (nd). ASQ Quality Resources. Retrieved from WHAT ARE THE EIGHT DISCIPLINES (8D): WHAT ARE THE EIGHT DISCIPLINES (8D)?
Pruitt, W. F. (2019, May). A Disciplined Approach. Retrieved from ASQ Quality Progress: http://asq.org/quality-progress/2019/05/back-to-basics/a-disciplined-approach.html
Quality One. (nd). Quality One. Retrieved from Eight Disciplines of Problem Solving (8D): https://quality-one.com/8d/

The 7 Basic Quality Tools: How and When to Employ Them

THE SEVEN BASIC QUALITY TOOLS
Utilizing the Seven Basic QC Tools consistently in your job and life can help you determine the solution to 95% of the problems that stand in the way to success due to quality issues. To clarify, I am in no way a self-help guru, and determining the root cause can do little to help you implement a solution in the workplace or day to day life, but it will point you down the path toward long term correction. Many solutions in the workplace are obvious, but resource allotment can easily pull a team from a long-term solution when the short term is so much more attainable. That is the way it is in life, as well- When we follow the path of least resistance, we usually end up in that same inescapable situation. Karou Ishikawa (1985) is credited with this statement concerning these tools: “….as much as 95 percent of all quality-related problems in the factory can be solved with seven fundamental quantitative tools”. Before I go further I want to clarify that eight tools will be discussed because over time the classic stratification tools is sometimes replaced with Flowcharting in some industries. Ishikawa’s statement can provide three key insights into these tools: 1. They are applicable in problem-solving situations most commonly encountered; 2. Excluding Flowcharts and Cause-and-Effect diagrams, they are quantitative in nature and rely on numerical data; 3. They are most commonly used as aids in tracking, monitoring, and analyzing data- rather than for planning functions
If you can’t describe what you are doing as a process, you don’t know what you’re doing.
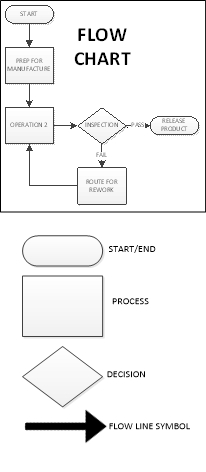
Flowcharting/Stratification

Stratification (per the definition of the ASQ) is the act of sorting data, people, and objects into distinct groups or layers, used in combination with other data analysis tools. I’m sure many of us reading this have dealt with the pain of ordering a huge mountain of non-sorted data into the appropriate “buckets” that will allow meaningful patterns to emerge. This is stratification, and a critical step to take during the data collection planning process is to determine the most effective strata for effective and efficient analysis. My personal preference is to have the collected data noted by geometric location, line, workstation, shift, date, product/process, and operator. Any other factors can be added as required, but this usually covers the key elements on a broad scale. The best time to use the stratification tool is to set up the data collection process so that all data is collected stratified, allowing each element to be easily analyzed and emergent patterns to clearly be recognized, otherwise much time will be spent sifting through data later. Flow Charts create their own kind of “bucket”. Each step of the process is separated and clearly defined, preferably with the next step considered the “customer” of the previous step. The graphic representation of the process displays the elements, components, or tasks associated with a process. A Flowchart can be a high-level view of a process and quite simple or can zero in on every step of the process (30,000 ft vs Ground Level). The high level would be employed when you are trying to determine where the problem is. After you have narrowed the problem down to a specific portion of the process a more detailed evaluation of the flow can help you while you are determining a root cause, but Flowcharts are usually aids, and only every now and then are obvious root causes revealed through a flowchart. Flowcharting should be the first step in a problem-solving exercise. If the flowchart already exists, be certain it is up to date with the current process. So you know, in the modern data driven world, Stratification has become built in to our data analysis, and as the Process driven concept evolved, in an environment where stratification became taken for granted, Flowcharts gained much more prominence. It is still very critical to understand both concepts.
Pareto Chart

Per ASQ definition, a Pareto Chart is a bar graph with some special properties. The lengths of the bars represent frequency or cost (time or money for instance) and are arranged with longest bars on the left and the shortest to the right. In this way the chart visually depicts which situations are more significant. The Term Pareto chart exists thanks to Vilfredo Pareto, who originally postulated the concept of the “80/20” rule to explain economic occurrences known as the “vital few” and the “trivial many”: It was observed by Pareto that approximately 20% of economic factors were the most vital to the outcome economic situations, with the remaining 80% of the factors being only of trivial to the final outcome. Juran and Gryna(1980) adapted the principle for quality applications to help quality improvement professionals focus on the 20% of categories/factors that had the most impact to the process.
As for when to use a Pareto chart, it can frequently be applied throughout the process; At the beginning of a new Quality Improvement project is usually when the attempt to narrow down the most vital areas to address for improvement is made. After the project has been identified, the team can use a Pareto chart to select the best areas to focus on, especially if there are too many possible paths to address. This is a good reason to have stratified data. It makes creating a Pareto chart much easier. If the team has a visual indication of where the most likely area for a solution is, then cross functional teams will find it easier to harmonize.
You will find that a Pareto chart can help you in day to day decisions, such as choosing a new vehicle. Some choices may be quickly eliminated from consideration based upon frequency of complaints and when you are down to just a few, the analysis must continue.
The implementation of a Pareto chart today is very easy. Minitab, Excel and many other forms of software can quickly produce a Pareto chart from the raw data. If you don’t have the software, the process is fairly simple:
- Rank the categories of data from highest frequency or relative frequency from highest to lowest from left to right.
- Label each Axis in a way that clearly defines the categories and the unit of measure
- Draw bars for each category that correspond to their respective counts. Keep the width of each bar the same
- Add Cumulative Counts and lines depicting the rising total. The final category on the right should may be marked “Other” to avoid a potential long list of trivial counts.
Cause-and-Effect Diagrams (Ishikawa)

Next is the Cause and Effect Diagram a.k.a. C&E Diagram, Fishbone (the most common term), or its proper term “Ishikawa diagram”. This tool was developed and popularized during the 1960s by Kaoru Ishikawa, one of the founding fathers of modern quality management. The term fishbone obviously is derived from its resemblance in shape, to that of a fish skeleton. The tool was developed to visually document the analysis of factors that impact a single problem or opportunity. The Causes are the factors, the Effect is the problem or Opportunity.
The C&E Diagram is most effectively employed in problem solving situations where the root cause of the problem or main cause(s) of the opportunity is unclear, but team members have situational awareness of the problems and potential causes. The tool is best utilized with a cross-functional team led by a facilitator who can help move roadblocks along. This usually occurs during an analysis stage of a six-sigma project or during the root cause investigation of a corrective action.
The method of using a Fishbone diagram is relatively simple but very useful for visual recording of team discussions. First, the problem or opportunity is stated inside a rectangle using a short description on the right side of the diagram- the “head” of the fishbone. Next, the major contributing factors are identified and stratified based upon the category each factor falls into. Sometimes one factor can be noted in multiple categories. This is usually the 6Ms (Mother Nature-environment-, Manpower-people-, Methods, Machinery-equipment-, Materials and Measurement). There are other variants based upon the task (service/management/sales) and the categories can be adjusted as the team desires, just be sure your net of categories is sufficient. After the major causes have been identified, the driving factors of each major cause are identified as “bones” added on to the original bones of the main skeleton, and the best way to inquire about each cause and sub-cause is to use the classic “why might this have happened?”. At this phase you do not yet need concrete data (though it will help greatly), so it should be subject matter experts helping to focus the potential causes in order to focus the team.
At the end of the exercise you should have a likely driving factor or factors for each category of bone that was relevant, allowing the investigation to proceed further. Sometimes at this point the team can feel that there are just too many things attacking our process, but the next step would be to continue, using Pareto Analysis based upon a common standard KPI being impacted by all factors on all of the driving factors in order to determine which ones are of greatest priority, and also to look at XY Diagrams for each driving factor vs Effect (see next section).
Back to using a Fishbone diagram to choose a new Car- If you gathered several auto enthusiast friends and help them hash your fishbone diagram out based upon your opportunity to purchase a new car, you may not determine what car to buy, but you would likely determine what areas of concern to watch for in your search, and focus your coming investigation based upon your team’s input. You might even find yourself doing some research to determine if any of cars or types of cars should be eliminated based upon the root causes of the most concerning factors you flagged.
Scatter Diagram/XY Diagram
Scatter Diagrams (also known as XY Diagrams) are used to graphically display quantitative indications of a relationship between two variables (usually an input factor and an output). What this effectively does is evaluate the performance of the input variable(X) to the output variable(Y), hence, the term XY diagram. What is being investigated is how these two variables correlate. When two sets of data are strongly linked together, they have a high Correlation. The term Correlation is made of Co- (meaning “together”), and Relation. Correlation is Positive when the values increase together, Correlation is Negative when one value decreases as the other increases, and when there is no discernable relationship there is no Correlation.
| See Example Below |

The method of employing a XY diagram does not require any deep statistical knowledge. The input variable should use the X axis, and the resulting output variables from the same operation, product, or time period, etc. should be noted in the corresponding Y axis (Excel, Minitab, and most other statistical software (JMP or R) are very effective at producing XY diagrams, or you can do it by hand by simply entering creating a graph on some graphing paper using a ruler (adjust the scale you draw the graph at so the most of the page is used). You do not need to know the correlation coefficient to see a strong relationship, as any strong correlation will usually be revealed visually.
In your research concerning that new car, you might see a strong positive correlation between red cars and speeding tickets and a strong negative correlation between hatchbacks and repair costs, but neither can be directly attributed to causality. Correlation does not imply causality, it only gives you a statistical leg to stand upon. Statistical Significance is a different matter entirely.
Check Sheets

Check Sheets (also knows as Tally Sheets) are a tool used to summarize and potentially visually represent a tally of event occurrences. This tool is most effective during an investigation when output events such as defects (or perhaps input events known/suspected to contribute to a defect) are being counted.
This method of utilization can be performed by hand using pen and paper but can also easily be performed on an electronic tablet. If the check sheet data is going to be moved to computer format, the data will be more reliable if it is initially entered using a computer format that allows for the transfer of data without error, as data transfer is a frequent point of failure.
Your check sheet should be uniquely designed to capture the specific data required to analyze the process, so any and all information pertaining to the process should be included. Generally, the elements that should be included at a minimum are: ID of Product & Process, Time frame of data collection period (per the data collection plan), Individual accountable for product or process and Individual accountable for the data collection, and traceability elements. The Check Sheet should include a clear data collection space to record data for event occurrences, as well as a space for comments.
The Data is recorded during the time frame for all events designated to be monitored. A simple check mark, dot, or X for each type of event will be recorded when it is observed (just one mark for each occurrence). After the designated time frame is complete the tally sheet itself will give a rough graphic representation of what events were most prevalent, but the data can easily be utilized using other tools such as Pareto Charts or Histograms (see next section).
When you are talking to all of your friends while searching for that new car you might enter the results into a check sheet on your phone anytime a bad report comes in from a bad dealership, and keep a tally sheet for good reports. That will help you decide which dealership to choose based upon customer service check sheet results.
Histogram
Histograms are normally used to visually represent the frequency of occurrences of events with event occurrences sorted into categories of defined ranges across the horizontal axis (called bins). Histograms help graphically display the distribution of event occurrences used to present “continuous data”, that is data that represents measured quantity (such as miles on a car). The data would then be collected into specific range categories to present a histogram when it is critical to understand how a particular set of data are distributed relative to each other. The Data are recorded in each column or category as they occur and columns are not sorted by frequency.
To construct a histogram from a continuous variable you first need to determine the amount of data to be used. If you were researching used cars, Miles on the odometer would be your horizontal, split into bins, with the recommended number of bins equal to √n. Each bin contains the number of occurrences in the data set that are contained within that bin. The resulting histogram (if enough data were collected) would clearly display your current bell curve of used car odometer readings and provide a visual of what the norm should be for a used car. This would help you avoid buying a car with too many miles on it and might help you spot a good deal.
When presenting the graphic, always provide a descriptive title, label each axis, provide a measurement scale for each axis, label the columns, and provide a data summary.
Histograms are usually considered large sample tools and are not really very reliable for small sample sizes. I would go with 50, and do not go with anything under 30. Statistical software, even Excel will help you with histogram creation.

9000 11000 11000 12000 12000 11000 12000 12000 13000 13000 14000 14000 15000 15000 20000 20000 20000 20000 30000 30000 30000 30000 30000 30000 40000 40000 40000 40000 40000 40000 45000 45000 45000 45000 45000 45000 45000 55000 55000 55000 55000 55000 55000 55000 55000 65000 65000 65000 65000 65000 65000 65000 65000 65000 65000 75000 75000 75000 75000 75000 75000 75000 75000 85000 85000 85000 85000 85000 85000 95000 95000 95000 95000 95000 95000 95000 95000 95000 105000 105000 105000 105000
Control Chart/Run Chart

Run Char Example
If you add control limits to the run chart, it will become a control chart. The control chart is also known as the Shewhart chart because it was developed by Walter A. Shewhart while working in Bell Labs. These charts are used to study the change in the process over some time. Though I am a strong believer in the power of SPC (statistical process control), as I have witnessed it in action, I will address only the Run Chart aspect of the 7 basic tools and save Control Charting and general SPC for a later post.
Run Charts are very effective tools used to track and monitor a metric or parameter without regard to control limits or tolerances and are frequently used to help Quality Engineers be come fully aware of how a metric/process is performing over time. This knowledge provides another signpost on the journey toward root cause analysis.
The basic method of creating a run chart is
- Select a single parameter to monitor
- Set a scale for the y-axis in a way that will distribute the data throughout the scale.
- ID the time intervals for the graph. (It should be based upon how data is collected)
- Collect and chart the data. (Minitab, Excel or any other SPC software can be used)
- Calculate the Average and plot the average on the Run Chart.
Conclusion
These tools, while helpful for most quality assurance teams, are primarily intended for quality control, or to be employed in concert as the precursor to Root Cause Analysis when a problem has many potential causes and the team needs to help focus on the most likely causes, allowing the team to move toward a final Root Cause Analysis in which the team can come to a consensus and execute a full-blown corrective action. The tools are versatile and because they are basic can be employed in many different combinations.
Though you can never really know if that car you purchase will break down quicker than you hope, or if its color will trigger a ticket writing spree by every officer that observes you, what employing the tools in real life can do is help you focus on the more likely problem areas so you can move on to a final analysis and final decision. I would advise you to not get caught up in over analyzing, or you will just go in circles without deciding (commonly referred to as Analysis Paralysis). If you are searching for a root cause in order to correct it, narrow down the potential causes to the most likely cases and then (with team input) pursue the potential cause(s) with the most return potential to the customer first, then the other stakeholders as determined by strategic alignment.


Processing…
Success! You're on the list.
Whoops! There was an error and we couldn't process your subscription. Please reload the page and try again.
