Lean Supply Chain Vs. Cutting Costs to the Bottom Line

REFLECTION: FOR STUDENTS: Study Deming’s philosophy, and and observe how critical Culture is to how Toyota dominates long term.
FOR ACADEMICS: Teach how interconnected organizations are more resilient than silo shaped organizations
FOR PROFESSIONALS/PRACTITIONERS: If Top Management is using Lean incorrectly for short term financial savings, demonstrate using COPQ how the Hidden Factory is damaging the company under the disguise of “Lean”. If they still will not react strategically, search for other employment, as the more valuable you are to the company, the more easily you are converted into short term savings. Cutting the experienced and hiring those fresh out of school with little to no experience is a quick way to claim “savings”. Replacing the years of lost experience by training the new employees and paying for all their errors is a massive expense.
The Goal of Lean Management
Some (especially top management and supply chain) misinterpret lean as the ability to do more with less by eliminating waste and decreasing costs.
This idea of Lean often leads to two critical issues-
1. Companies cutting labor that is no longer “needed” to “reduce waste” so they can “do more with less.” It is a fancy way of telling the rest of the company employees to work harder to take up the slack for all the people I just fired and is very damaging to buy-in. Companies lose tribal knowledge that the company was unable to capture, and new learning costs are incurred when the costliest employees are cut to save money (and it is a frequent occurrence when Lean is used for cost-cutting).
2. Supply Chain chooses suppliers based upon financials, and OTD, not supplier quality. Lots of promises and preliminary approvals that drag on and on. You get what you pay for. Low cost frequently equates to low quality. If a competitor knows their product is better, they will raise the price because others will want to buy it. Cheap suppliers look good for the first quarter, but when the hidden costs of rework and recalls hit, somebody has to be held accountable.
Was it Quality’s fault? Supply Chain’s fault? No. It was the Administration was accountable for allowing the hidden factory back into the culture. Supply Chain especially should be able to understand when the QM tells the board that we need to invest in better suppliers. The goal of Lean management is to maximize customer value while minimizing waste. Allowing rework into the factory through the supplier is a total waste of resources, and it can cost a lot of money, time, and, frequently, loss of reputation in the eyes of potential customers. Investment in your company brings long term gains, not slashing people and resources.

It is also essential to set up an APQP/PPAP process that matches the needs of all the stakeholders. Two main factors to consider are the expected Volume of orders for the product or service and the Variety of products / and services. With products of high levels of variety (such as frequent custom orders) with relatively low product volume, Agile Project-type planning control is most effective. Low variability (not much change customer to customer), but substantial orders, would bring about a need for lean planning.
Conclusion
Lean is not a tool to be used like a Machete to “cut the fat” quarter to quarter. Eventually, while you are hacking at the perceived “weeds and vines” you will cut your company’s foot off and some of your foundation will be lost. Add value and eliminate waste carefully by categorizing value and waste as a team.
Processing…
Success! You're on the list.
Whoops! There was an error and we couldn't process your subscription. Please reload the page and try again.


How Software Quality Engineering and Design Quality Are Similar

REFLECTION: FOR STUDENTS: If your education looks as if it may lead to a point where you have interactions that involve a QMS, be sure to pursue at least a basic understanding of software, as that understanding will be gold in all future industry employment.
FOR ACADEMICS: AI and ML are coming, but it will be a while before any doctors or engineers are actively replaced, but it would be wise to teach your students how to think for yourself, not just rely upon the computer. Teach students to be the person who writes the program or qualifies the program, not the person who is told by the computer what to do.
FOR PROFESSIONALS/PRACTITIONERS: Learn all you can about the software world if you have not yet. If you are purely a Software Quality Engineer, get as much exposure to other quality systems to help open your mind up to different problem-solving pathways. Always be a lifelong learner.
Definition of Quality
There is no single definition of quality that has ever or likely ever will be agreed upon even in a single company, much less an entire industry or across industries, but the ISO/IEC/IEEE Systems and Software Engineering-Vocabulary (ISO/IEC/IEEE, 2010)
provides an excellent layout of every aspect of defining quality.
- The degree to which a system, component, or process meets specified requirements
- The ability of a product, service, system, component, or process to meet customer or user needs
- The totality of characteristics of an entity that bears on its ability to satisfy stated and implied needs
- Conformity to user expectations, conformity to user requirements, customer satisfaction, reliability, and level of defects present
- The degree to which a set of inherent characteristics fulfills requirements
Each organization must decide what quality is, however, only a world-class organization will always be using the feedback from all stakeholders to evolve the organization’s definition of quality so that stakeholders are satisfied at every level.
Changes Are Coming
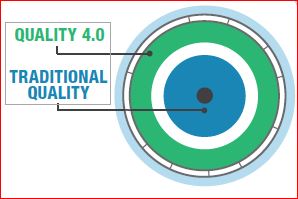
I have written a couple of posts about how Quality 4.0 and Industry 4.0 are here. However, based upon the fact that the Quality industry is in many areas still building the foundations of a Quality culture that will support Quality 4.0, there are likely to be many quality professionals who fall into one of three major groups.
Some may be in a state of denial or unawareness of the exponential growth level of the emerging technology and believe things will stay the same as they have for all these years. The next group is made up of those who are fully aware of the changes that are coming. The members of this group and are getting ready for the inevitable change. The last, and most likely smallest group (though I have no formal data, shame on me), would be those who know what is coming but actively do not want the change to occur.
The reason I believe that would be the smallest group would be the fact that the vast majority of quality professionals are problem solvers, change agents, and not comfortable with things just staying as they are. The old “If it isn’t broke, don’t fix it” axiom is the antithesis of the Quality mindset.
Software Quality Engineering
In the past few years, I have witnessed the medical device industry evolve rapidly. A few years ago, I saw DHFs (Design History File), DMRs (Device Master Record), and DHRs (Device History Record), all kept on paper in files in a locked room and carefully controlled. Quickly the entire paradigm shifted to Cloud storage of these documents with ultra-tight security, in addition to management of routing of document approvals moving from physical signatures to electronic signatures. I also witnessed software become officially regulated as medical devices (SaMD).
Software Quality Engineering is- The study and systematic application of scientific technology, economic, social, and practical knowledge, and empirically proven methods, to the analysis and continuous improvement of all stages of the software life cycle to maximize the quality of software processes and practices, and the products they produce. Generally, increasing the quality of software means reducing the number of defects in the software and in the processes used to develop/maintain that software (WestFall, 2016). Software development usually uses an Agile project management approach. Agile project management seems to draw heavily from the Lean philosophy, which focuses on creating better customer value while minimizing waste. Both philosophies emphasize fast deliverables. The emphasis of Lean is on reducing waste and unnecessary steps; however, Agile emphasizes breaking large tasks into small ones and delivering in short sprints. Both Lean and Agile use some sort of an action loop. In Lean, this is the build-measure-learn cycle, while Agile’s scrum methodology uses an iterative sprint approach (L. Allison Jones-Farmer, 2016).

The iterative steps used as part of the Agile Scrum methodology help prevent excessive costs. When a defect is not caught early in the development of software, the defect can impact many more aspects of the software. The later in the life cycle the defect is detected, the more effort (and therefore expense) it will take to isolate and correct defects. A single defect in the requirement phase may have a “butterfly effect” and cause exponential levels of cost as the defect goes undetected.
At the end of each iteration, the goal would be to have a working example demonstratable for stakeholder review and feedback so that any issues with correctness or quality can be addressed in the next iteration (WestFall, 2016).
Traditional Design Quality
Design Quality from the manufacturing perspective aligns closer to Crosby’s viewpoint of the need for a well-defined specification against which to measure quality. One of the things about the fast-changing Quality world is that software is less about the reproducibility to spec and more about innovation. As the manufacturing world has found itself thrown into a massive acceleration in the last few decades, traditional design perspectives have been re-evaluated. Engineering tools like TRIZ have been employed to help spur innovation in design and problem-solving. Design For Six Sigma (DFSS) shifted product design away from just doing it right the first time toward robustly employing QFD to obtain the voice of the customer. The best DFSS process for a new design (in my opinion) would be the IDOV method- Identity (obtain VOC & CTQs), Design, Optimize, Validate. At the Validate stage, a prototype is tested and validated, with risks thoroughly analyzed (and as required, sent back to an earlier stage if validation is not accepted) (Kubiak, 2017). I have seen more and more manufacturing operations learning to use agile methods for design, frequently combining Agile with Lean, Six Sigma, or Lean Six Sigma depending upon the culture and knowledge base. It is clear that as software, apps, and AI become integral parts of product and production, the pace at which innovation must occur to meet customer requirements will continue to grow, perhaps eventually leading to a permanent fusion of Agile, Lean, and Six Sigma.
Conclusion
There are many other methodologies out there, like the waterfall mythology, which has lost a bit of popularity over the past few years to Agile methods, as well as CMMI, which I have heard conflicting reports on how compatible CMMI is with Agile. I would appreciate input from those in the software industry who can tell me firsthand how well CMMI and Agile work together. Software DevOps is effectively designing a product for stakeholders from ideation to operational release and monitoring/maintenance. Designing a physical item to sell on the market based upon the VOC using a QFD may be slower and use a more thorough investigation of the requirements and desired outputs (since you are addressing something tangible rather than an idea for a program). An idea that can provide value (software) is much harder to define in a neat specification box. Still, just like a DOE, you keep adjusting your settings and continue trying until you determine what factors are critical. Then you optimize the settings for your critical factors to obtain the best outcome based upon cost, functionality, and VOC. If you are worried about the coming changes, do not be worried, embrace the change, and be part of the change. Yes, in 20 years, we will all be behind a computer console writing code (if AI has not replaced al the Quality Engineers), but as long as you are looking forward, you will be moving in the right direction.
Processing…
Success! You're on the list.
Whoops! There was an error and we couldn't process your subscription. Please reload the page and try again.
Bibliography
ISO/IEC/IEEE. (2010). ISO/IEC/IEEE 24765 Systems and Software Engineering. Geneva, Switzerland: ISO New York, NY.
Kubiak, T. a. (2017). The Certified Six Sigma Black Belt Handbook Third Edition. Milwaukee: ASQ Quality Press.
L. Allison Jones-Farmer, P. T. (2016, 10). asqstatdiv.org. Retrieved from ASQ: http://asq.org/statistics/2016/10/agile-teams-a-look-at-agile-project-management-methods.pdf
WestFall, L. (2016). The Certified Software Quality Engineer Handbook 2nd Edition. Milwaukee, WI: ASQ Quality Press.

How to Communicate the Cost of Quality (COQ) In a Way Top Management Understands

REFLECTION: FOR STUDENTS: Use your business and management classes to prepare you for Improvement Project management. Nothing happens in a business unless it is profitable.
FOR ACADEMICS: If you are teaching Project Management be sure to teach more than “Top Management must support your team”. It will help greatly if team members understand why top management must buy into a project, as the economic model cannot be explained at the beginning of every project.
FOR PROFESSIONALS/PRACTITIONERS: If your organization finds itself in a silo mentality between production, quality and management, always use cost as the negotiating method. Hard dollars are not subjective or debatable.
What is the Cost of Quality?
I use the term Cost of Quality because the common term Cost of Poor Quality (COPQ) seems to fail to capture all the efforts in the quality metric that should be communicated to Top Management.
For many years there was a lack of understanding between the production and quality department. Quality usually knew when a process was wasteful, but production was not particularly concerned with operational excellence. The prime metric from a production standpoint was, “How many widgets did we produce this shift?” and “Did it meet our Quota?”. The scrap costs and rework costs were hidden deeply in the metrics, not because the data did not exist, but because the data were not being actively tracked. Top Management frequently was blind to the full cost of all the quality efforts and failures that were occurring during production (or even design quality costs).
This lack of communication led to the infamous “Hidden Factory” effect that drove the first wave of modern Quality Guru’s to try to bring Quality to the forefront of Business consideration. Taguchi, Crosby, Juran, Deming, Ishikawa, and Ohno all had similar views on waste, though they did not all have the same philosophies.
The end result was: After many years, the Culture of Quality and Change Management has become more the norm (though there is still far to go in many areas). Most Top Management has a language with which they can talk to the Quality and Production departments and can share, and that language is Dollars. Top management had always wanted a bottom-line impact report. It was not genuinely concerned with what Quality had to say until Quality started talking about lost dollars that impacted the bottom line.
Since the actual cost of producing a product to spec is approximately 15% for manufacturing firms, varying from as low as 5% to as high as 35% based upon product complexity of total costs, it presents a clear opportunity to cut the bottom line for reducing these overall costs (Joseph M. Juran, 2010) (Bill Wortman, 2013).
There are three primary categories of Quality Costs categorization: Prevention, Appraisal, and Failure. Once your organization has a firm classification of these costs, choosing to document the quality costs will provide project managers with a way to measure and prioritize Quality Improvement projects. Peter Drucker is credited with the obvious truth – “If it cannot be measured, it cannot be improved”.
Though some individual items such as Audits overlap, this is a useful high-level guide to categorizing your Quality Costs. (Failure has been divided into Internal and External Failures)
- Prevention Costs of Quality- Total cost of all activities used to prevent poor quality and defects from becoming part of the final product or service.
- Quality Training and Education
- Quality Planning
- Supplier qualification and supplier quality planning
- Process Capability evaluation (including QMS audits)
- Quality Improvement activities
- Process Definition and Improvement
- Appraisal Costs of Quality- The total cost of analyzing the process, products, and services
- Document Checking
- Analysis, review and testing tools, databases, software tools
- Qualification of the supplier’s products
- Process, product, and service Audits
- V & V activities
- Inspection at all levels
- Test equipment maintenance
- Failure Costs of Quality- The costs which result from products and services not conforming to requirements or customer/user needs.
- Internal Costs of Failure
- Occur prior to delivery
- Scrap
- Design changes
- Repair
- Rework
- Reinspection
- Failure documentation and review
- Occur prior to delivery
- External Costs of Failure
- Occur after delivery or during the furnishing of the service
- Customer complaint Investigations
- Pricing errors
- Returns and Scrap
- Warranty Expenses
- Liability claims
- Restocking
- Engineering Change Notices
- Occur after delivery or during the furnishing of the service
- Internal Costs of Failure
- (Wortman, 2013) (WestFall, 2016)
Conclusion
Top management support is required for an improvement project.
Any quality dept. will want to improve a process, but for a business, a business case must be presented to top management so they will help remove the roadblocks and provide resources. The quality department must be able to present the estimated ROI (Return on Investment) using the Cost Benefits Analysis to show that there is a viable business case for supporting the improvement project to gain support for the project. Even though improving a process may be the smart thing to do, sometimes it is not the financially viable thing to do at the time. Keep those projects on a back burner and monitor them, though. At some point, some changes may make the improvement much more viable.
Processing…
Success! You're on the list.
Whoops! There was an error and we couldn't process your subscription. Please reload the page and try again.
Bibliography
Bill Wortman. (2013). The Certified Biomedical Auditor Primer. West Terre Haute, IN: Quality Council of Indiana.
Drucker, P. (1954). The Practice of Management. New York City: Harper & Row.
Joseph M. Juran, J. A. (2010). Juran’s Quality Handbook (Sixth Ed). New York: McGraw-Hill.
WestFall, L. (2016). The Certified Software Quality Engineer Handbook 2nd Edition. Milwaukee, WI: ASQ Quality Press.

Team Development

REFLECTION: FOR STUDENTS: When institutions mandate team learning, were you provided proper project management skills or were you thrown to the wolves to meet administrative requirements? Teamwork should be a holistic process, and if team learning is mandated, then the proper training should be provided for all teams to begin learning on an equal footing (a few freshmen out of high school may be in the same class as project managers). You are a customer! Do not fear the administration and use your Voice as a Customer to demand proper teaching methods be provided.
FOR ACADEMICS: I have heard horror stories of the teams that never move beyond forming during mandated team projects, and then the entire team is penalized no matter how hard they worked or how much they learned. In real life, an obstinate member of a team would be kicked out by the sponsor or team leader (or even fired from their job) before that member was allowed to impede the goal of the team (after some serious coaching). Still, academia frequently masks that aspect of the private sector from students. Have you integrated yourself as the “sponsor” to allow the team leader or team to appeal directly to you to resolve unresolvable conflict issues, perhaps making it part of the grade (based upon the team’s presentation and documentation of any issues)?
FOR PROFESSIONALS/PRACTITIONERS: Do you consider likely team dynamics and personal histories that might be significant distractions or believe the project will blind the team members to personal biases? If you believe the goal will overcome personal biases, I would say it can, but usually only under duress. Adding extra factors for a team to overcome is like adding additional factors to a DOE. It takes many more runs before they are sure they have it right, so if you know of conflict factors that can be eliminated, the time to do it would be when the team is chosen, though sometimes there are not enough resources for that level of filtering.
Common Types of Teams
Teams can manifest as required to achieve the goal, and it is essential to remember that the configuration of the team will be a significant contributor to how the team functions, so be sure your team is configured with the end goal in mind.
- Process Improvement Teams
- Self-Managed Teams
- Temporary/ad hoc teams
- Work groups
- Cellular teams
- Special Project Teams
- Virtual Teams
- Combinations of two or more of the above types
Team Selection
Management should select the team leader to ensure 100% management support for the team’s goal.
Team members may be selected by management or the leader. Still, I would suggest empowering a leader to choose the best team when a team leader chooses his/her team, using the five primary areas of competence known as the KESAA factors to analyze the fit of the candidates for the needs of the project.

Formal Education, Degrees, Educational Certifications, Professional Certifications, Self-Study achievements
Experience
Time spent actively applying knowledge and skills in pertinent types of organizations and industries and in jobs/positions held
Skills
Skill certifications documented training and demonstrated proficiency in the use of relevant tools and equipment
Aptitude
Natural talent, capability, capacity, innate qualities, deftness, adaptability to change, high learning speed
Attitude
Manner of showing one’s feelings or thoughts; one’s disposition, opinion, mood, ideas, beliefs, demeanor, state of feeling, reaction, bias, inclination, emotion, temperament, mental state, frame of mind, ease in accepting and adopting new or changed plans and practices.
-After utilizing a KESAA analysis, be sure you have every need for the project covered with a well-chosen cross-functional team.
Stages of Team Development

Stage 1: Forming
- Proud to be selected
- Anxious
- New team experience
- Forming team structure
Individuals come together and merge, each with their perceptions and priorities. This forming helps the team to move closer to a single entity and to define and clarify the team’s purpose, goals, and roles and rules for acceptable behavior within the group (norms).
Stage 2: Storming
- Individualistic thinking
- Struggle between external loyalties and devotion to team goals
- Fluctuating attitudes
- Confrontations
- The team’s task is understood
At this point is when individual goals conflict with team needs and objectives, and initial decisions are based upon old paradigms or perhaps just old emotions and conflicts.
Current information relative to the task and goal must be pooled and utilized. Then the team has to begin to shape itself by overcoming major conflicts and focusing on the proper behavior required to succeed for the next step in the team’s evolution.
Stage 3: Norming
- Team coalesces
- Cooperation
- Individuals willing to dialogue
- Conflicts reduced
- Focus is on team objective
At this stage, the individual members of the team overcome their personal biases and previous conflicts, coalescing into a team. The team finds itself shifting the full focus of the team’s efforts to meeting team-related challenges rather than individual concerns. Discussion of differences for the sake of the team becomes the Norm, resulting in a standard of team cooperation and constructive dialogue.
True Diversity of Thought emerges. Note: from my experience- (if the Norm fails to be achieved, the Performing level usually will not be optimal, though it can still succeed).
Stage 4: Performing
- Team has matured
- Smooth, cohesive unit
- Focus on process and goal
- Feelings of satisfaction
- Achieving goals
The team members have a good understanding of one another’s strengths and weaknesses, and how they contribute to the end goal and are effectively able to resolve conflict and appreciate the team as an individual entity. This is the stage where the real strides toward achievement are occurring.
Adjourning
Tuckman’s original model ended at the performing stage, but a final stage is now standard- the Adjourning stage. The reason this phase is so critical is that though the stages represent the normal logical procession of team development, team dynamics can influence the actual flow of progress. Forcing teams to regress to earlier stages to overcome previous assumptions about one another, decisions made upon inaccurate information, or to welcome new team members is a real possibility. Some teams never progress beyond a certain point of development due to outside forces combined with inner team dynamics.
Limited project duration and poor group dynamics can be significant issues.
Anytime a team successfully achieves a Performing level, and the team’s mission has been successful, the post-project stage of Adjourning should be performed to capture lessons learned, what was accomplished, complete, and assign documentation, celebrate, and formally disband.
(Russell T. Westcott, 2014)(CSSBB Primer, 2014)(Kubiak, 2017)
Conclusion
Team Dynamics are often overlooked during critical projects for the data, but important decisions are often made based upon how the individual members of the team work together as a team. Never underestimate the importance of a leader and facilitator with excellent soft management skills.
Processing…
Success! You're on the list.
Whoops! There was an error and we couldn't process your subscription. Please reload the page and try again.
Bibliography
CSSBB Primer. (2014). West Terre Haute , Indiana: Quality Council of Indiana.
Kubiak, T. a. (2017). The Certified Six Sigma Black Belt Handbook Third Edition. Milwaukee: ASQ Quality Press.
Russell T. Westcott. (2014). The Certified Manager of Quality/Organizational Excellence. Milwaukee, WI: ASQ Quality Press.

8D vs PDCA & DMAIC
REFLECTION: FOR STUDENTS: Are you using critical thinking or using a paint by the numbers method to solve problems?
FOR ACADEMICS: Are you providing your students with the tools needed to distinguish between “guidelines” and mandates?
FOR PROFESSIONALS/PRACTITIONERS: Is your organization allowing you find the true root cause of an issue or forcing you to fill out a form within a certain time frame? Try to convince top management to allow teams to properly explore root causes, and if management continues to violate standards by ignoring the concept of due diligence in favor of meeting the closure rate when more time should have been allotted- file a CAPA. It is your duty as a Quality Professional.
What is 8D?
I have been performing CAPAs for many years. I have employed many methods: The Tried and True PDCA, the DMAIC approach, and even utilized the A3 path when the visual display of ongoing CAPAs was critical to communication (or mandated by policy). The Eight Discipline (8D) Approach has been the path that was least used by me, as it was (to me) least flexible. For those who are proponents, it works fine, but it seems more about CAPA closure by the numbers and documentation than it is about teaching your team to be independent critical problem solvers. While 8D will work well in any industry if implemented correctly, 8D is more template-based than PDCA. Have no doubt, DMAIC is quickly becoming template-like via software applications. A basic template is a useful guide, but the less controlled the problem solving, the more likely the team is to arrive at an innovative solution.
For those who are unsure what the Eight Disciplines are, let me elaborate on the Eight Disciplines:
Originally Ford developed the 8D method in the late 80s, and it spread to most of the automotive industry.
The Ds in this method are not acronyms (as many seem to struggle with), but rather a set of “Disciplines” to follow for problem-solving. These Disciplines were widely transferred to “forms” that became “8D Forms”, used for root cause analysis and correction of problems with unknown causes.
8D Method
- D0- Plan for solving the problem and determine resources needed
- Before 8D analysis begins, proper planning will always translate to a better start.
- SME Input
- Collect data on issues
- Identify any need for an Emergency Response Action (ERA)
- D1-Use a Team
- Choose the right type of team, right team members
- Teams require proper preparation.
- Set the ground rules
- 8D must always have two key members: a Leader and a Champion / Sponsor
- D2- Define and Describe the problem
- Specify by identifying in quantifiable terms the who, what, where, when, why, how, and how many (5W2H)
- 5 Why or Repeated Why (Inductive tool)
- Problem Statement
- Affinity Diagram (Deductive tool)
- Fishbone/Ishikawa Diagram (Deductive tool)
- Is / Is Not (Inductive tool)
- Problem Description
- D3- Develop interim containment plan
- Implement Interim Containment Actions (ICA)
- Verification of effectiveness of the ICA is always recommended to prevent any escapes to customers
- D4- Determine, identify, and verify root causes and escape points
- Comparative Analysis listing differences and changes between “Is” and “Is Not”
- Development of Root Cause Theories based on remaining items
- 5 Whys
- C&E Diagrams
- Determine Escape Point, which is the closest point in the process where the root cause could have been found but was not
- Review Process Flow Diagram for location of the root cause
- D5- Choose Permanent Corrective Action (PCA)
- Establish the Acceptance Criteria which include Mandatory Requirements and Wants
- Perform a Risk Assessment / Failure Mode and Effects Analysis (FMEA) on the PCA choices
- Based on risk assessment, make a balanced choice for PCA
- Select control-point improvement for the Escape Point
- Verify the PCA will resolve root cause of problem and any escape points issues
- D6- Implement and Validate PCAs for problem/nonconformity
- Define and Implement the best PCAs
- Validate PCAs using objective measurement
- D7- Prevent recurrence
- Review Similar Products and Processes for problem prevention
- Develop / Update Procedures and Work Instructions for Systems Prevention
- Capture Standard Work / Practice and reuse
- Assure FMEA updates have been completed
- Assure Control Plans have been updated
- Preserve and share the knowledge, preventing problems on similar products, processes, locations or families
- D8- Congratulate your team
- Archive the 8D Documents for future reference
- Document Lessons Learned on how to make problem-solving better
- Before and After Comparison of issue
- Celebrate Successful Completion
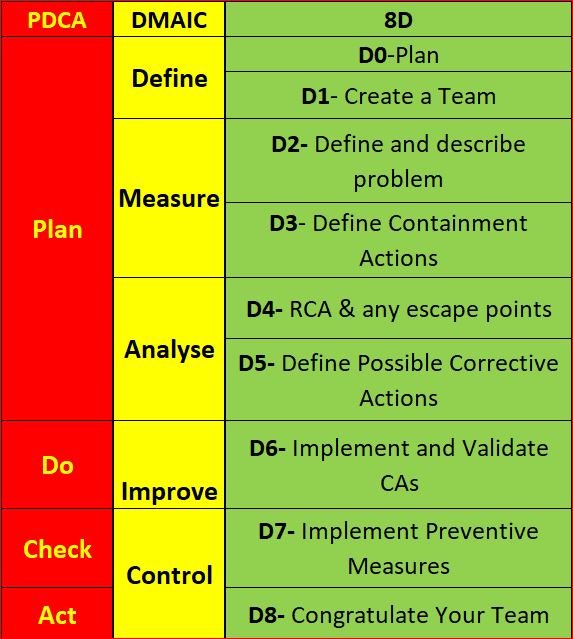
If you have interacted with a Six Sigma Team or a PDCA Root cause team, you know how the DMAIC and PDCA compares. For illustration, I have them side by side. 8D is much more broken down than the others. Using PDCA, the assumption is that a team acting in a PDCA cycle will have top management support and that those involved have the proper knowledge and training required to gather and analyze data to determine a solution. Also assumed is that the resources are available to improve the issue, Measurement of the results is always part of the cycle, and reacting to the final results of the Check on the improvement will yield either a successful CA/Improvement or begin a repeat of the cycle (basically the scientific method).
Most consider DMAIC the same as PDCA, just more focused on clarifying the PDCA cycle in order to reduce iterations by shifting the focus away from potential multiple cycles to achieving the most effective improvement the first time (though failure is still built into the process). The 8D method is once again pretty much the same process, as you can see.
When DMAIC and 8D are highly templated, a lot of the focus moves from solving the root cause toward closing the CAPA within the mandated time.
Making problem-solving quick and easy makes it easy to pencil whip. I would suggest you avoid the potential pencil whip methods. Have a group that must think for themselves and writes the report using only basic guidelines (not templates).
Conclusion
While I have clearly indicated I am not a fan of 8D and not happy with the way DMAIC is being pushed into templates, I do not mean to say that any single technique is better than another. Essentially, they are all the same method, re-focused. 8D is very conducive to utilizing documentation of project results and assigning work breakdown structure accountabilities (WBS) DMAIC is better for cross-functional communication and can be used for similar documentation. The Shewhart PDCA cycle is more of a high-level outline that allows the improvement project to be adjusted as required by SMEs. Choose the method that suits your needs, and as long as a cross-functional team performs proper due diligence with full top management support, the outcome will usually be similar regardless of the method chosen.
Processing…
Success! You're on the list.
Whoops! There was an error and we couldn't process your subscription. Please reload the page and try again.
Bibliography
ASQ. (nd). ASQ Quality Resources. Retrieved from WHAT ARE THE EIGHT DISCIPLINES (8D): WHAT ARE THE EIGHT DISCIPLINES (8D)?
Pruitt, W. F. (2019, May). A Disciplined Approach. Retrieved from ASQ Quality Progress: http://asq.org/quality-progress/2019/05/back-to-basics/a-disciplined-approach.html
Quality One. (nd). Quality One. Retrieved from Eight Disciplines of Problem Solving (8D): https://quality-one.com/8d/

Hypothesis Testing

REFLECTION: FOR STUDENTS: Always remember to use data and analysis to make decisions. Rely upon your own critical thinking skills, and do not allow your team to be derailed by groupthink.
FOR ACADEMICS: Teach critical thinking skills first, not expected behaviors. Without each individual able to independently and confidently voice objection to the group view, there can be no growth.
FOR PROFESSIONALS/PRACTITIONERS: Choosing the right hypothesis test can be daunting. It’s always best to understand, but if you are using statistical software like Minitab, never hesitate to use the software to choose your path based on the data and then double-check with a statistician to be certain you are taking the correct path.
Basic Terminology
(Don’t worry- not going to do a deep dive into statistics, just a basic application of hypothesis testing)
H0: is a test of statistical significance called the null hypothesis. The test of significance is designed to assess the strength of the evidence against the null hypothesis. Usually, the null hypothesis is a statement of “no effect” or “no difference” symbolized as H0. (The one we hope to disprove and usually commonly accepted)
Ha: This symbol represents the alternative hypothesis- the one for which we want to develop supporting evidence and prove and should usually be the opposite (inverse) of the null hypothesis.
α-value: alpha level or “significance level”- By definition, the alpha level is the probability of rejecting the null hypothesis when the null hypothesis is correct. Translation: It’s the probability of making a wrong decision.
Confidence Interval (also CI): CI provides the boundaries for an unknown parameter of a population with a specified degree of confidence that the parameter falls within the interval. CI is equal to 1-α and the typical levels of confidence used to test a hypothesis are 0.99, 0.95, and 0.90
Parameter: summary description of a fixed characteristic or measure of the target population. A Parameter denotes the actual value that would be obtained if a census rather than a sample were undertaken.
[Ex: Mean (μ), Variance (σ²), Standard Deviation (σ), Proportion (π)]
Population: Population is a collection of objects that we want to study/test. The collection of objects could be Cities, Students, Factories, Parts, etc. It depends on the study at hand.
In the real world, it isn’t effortless to get complete information about a population. Therefore, we draw a sample out of that population and derive the same statistical measures mentioned above. These measures are called Sample Statistics.
Statistic– a summary description of a characteristic or measure of the sample. The Sample Statistic is used as an estimate of the population parameter.
[Ex: Sample Mean (x̄), Sample Variance (S²), Sample Standard Deviation (S), Sample Proportion (p)]
p-value: Probability of obtaining a result as extreme as, or more extreme than, the result obtained when the null hypothesis is correct- Ranges from 0 to 1 (obtained as a result of several different types of hypothesis tests) (Kubiak, 2017) (Crossley, 2008)(Minitab Editor, 2012)
Testing
Fundamentally, Hypothesis testing is a test of significance and tests whether events occur by chance or not. Statistically, a sample is drawn from a population, and a statistic is computed from that sample. If that statistic is a mean, the hypothesis tests whether the mean occurred by chance at some specified level of significance. There are many different testing methods available based on the data available. Still, there is always a chance that even with a flawless analysis of a sample, the conclusion will yield a false result relative to the population. There are two types of errors that can arise when testing a hypothesis-
Type I Error: Occurs when we reject the null hypothesis that is true (probability of Type I Error is equal to α).
Type II Error: Occurs when we fail to reject a false null hypothesis (probability of Type II Error is equal to 1-α).
H0 is “false but not rejected Type II or ß error
Interpreting Hypothesis Test Statistics
Confidence level + alpha = 1
As you increase alpha, you both increase the probability of incorrectly rejecting the null hypothesis and decrease your confidence level.
If the p-value is low, the null must go.
If the p-value is below the alpha—the risk you’re willing to take of making a wrong decision—then you reject the null hypothesis “if the p-value is low, the null must go.” If the p-value exceeds alpha, we fail to reject the null hypothesis. Another way to remember it is, “if the p-value is high, the null will fly.”
The confidence interval and p-value will always lead you to the same conclusion-
If the p-value is less than alpha (it is significant), then the confidence interval will NOT contain the hypothesized mean/variance; however, if the p-value is greater than alpha (it is not significant), then the confidence interval will include the hypothesized mean/variance. (Kubiak, 2017) (Crossley, 2008)(Minitab Editor, 2012)
Deciding upon the correct test method:

It is always best to understand the potentially daunting task of hypothesis testing, and sometimes critical, cut never fear. Most modern statistical software (even many Excel add-ons) will help guide you down the proper path as long as you have the data, know what kind of data you have, and have determined if it is normal or non-normal.
Conclusion
As promised, this was not a deep dive. The more you know about statistics, the more likely you will draw the correct conclusion when you evaluate your test statistics against your hypothesis. It is critical to remember that while you are doing mathematical gymnastics or navigating Minitab, the hypotheses are not really about the data; instead, you should think about the processes producing the data. Always understand the implications of the hypothesis test on the associated process(es) in order to take the correct actions.
Processing…
Success! You're on the list.
Whoops! There was an error and we couldn't process your subscription. Please reload the page and try again.

Bibliography
Crossley, M. L. (2008). The Desk Reference of Statistical Quality Methods (2nd Ed). Milwaukee, WI: ASQ Quality Press.
CSSBB Primer. (2014). West Terre Haute , Indiana: Quality Council of Indiana.
Kubiak, T. a. (2017). The Certified Six Sigma Black Belt Handbook Third Edition. Milwaukee: ASQ Quality Press.
Minitab Editor. (2012, October 01). https://blog.minitab.com/blog/alphas-p-values-confidence-intervals-oh-my. Retrieved from Minitab Blog: https://blog.minitab.com/blog/alphas-p-values-confidence-intervals-oh-my

The Process Audit Framework

REFLECTION: FOR STUDENTS: Be mindful in your scholarly efforts. Mindfulness will reflect well both as auditee and an auditor
FOR ACADEMICS: Teach the art of communication, for clear communication is fast becoming a lost tool, but in the future good communication skills will be golden
FOR PROFESSIONALS/PRACTITIONERS: Anyone who has endured an audit knows what a burden it can seem to be. My advice would be to take every audit as an opportunity to improve your process. Do not try to slip by simply by knowing when to keep quiet, but be open and honest with the auditors and your process, improve, and then repeat. Eventually your process will withstand all but the most biased audit process.
If you are an auditor, do not go into the audit searching for failure. Those are the auditors who find themselves asking “why is the factory hiding everything from me?”. Well, it may be because they know you see everything possible as a failure because you have already failed them and they know it. Be more objective and your audit will go much easier.
Process Audit
The general definition of a Process is – any series of interrelated steps that, when performed in sequence, turns inputs into outputs. A process usually adds value with its output, but when evaluated overall, a process may not add value based upon non-value-added costs in the process. Because processes requirements are not always adhered to, and because processes are not always designed to produce the optimum output with maximum efficiency, frequent process audits should be performed to confirm that the process is being adhered to per the SOP (Standard Operating Procedure) and that opportunities for improvement are highlighted so that process improvement can begin.
An excellent way to approach a process audit is to look at the process that you are auditing as a set of components: inputs, process performance, and outputs. Looking at the process from the 6M’s you can develop questions around each of the M’s
- Man
- Do operators demonstrate competence in the operation?
- Are all operators trained?
- Machine
- Is all equipment calibrated?
- All equipment validated as required?
- Does equipment meet TPM schedule?
- Method
- Do the methods employed for production match SOPs/WIs?
- Are all SOPs/WIs to current Rev?
- Are any procedures contributing to bottlenecks or potential NCs?
- Material
- Are all Materials correct and traceable?
- Any issues with defective materials?
- Measurement
- Is there an active Data Collection Plan?
- Any discrepancies with data?
- Mother Nature
- Environmental control in-spec?
- Any Safety Hazards observed?
Process Performance and Monitoring
- Performance
- Process controlled?
- Are outputs as expected per process?
- Monitoring
- Data Recorded as required?
- Data Trending properly?
- Effective monitoring in place?
Process Outputs
- Products
- Meets spec?
- Yields as expected?
- Records
- All required available?
- Complete?
- Correct?
- GDP followed per company requirements?
- Signals
- Alerts, alarms, status signals sent as required?
- Consequences (risks)
- Unexpected or expected consequences documented and evaluated?
- Contingencies in place?

(Lance B. Coleman, 2015)
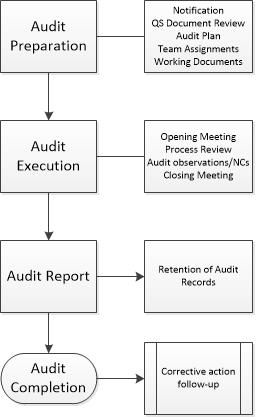
High level Process Audit Framework-
- Audit Preparation
- Audit Execution
- Audit Report
- Retention of Audit Records
- Audit Completion
- CAPA follow up (as required)
Audit Preparation
Unless regulatory requirements mandate otherwise, the Lead Auditor should notify the auditee in advance of a coming audit. The Lead auditor should also evaluate the quality system to determine if the implemented controls identified in the process meet regulatory requirements. The most effective way to accomplish this review is to assess the quality manual and top-level SOPs. If it is clear that the system audited does not meet regulatory requirements, the auditee should be informed the audit will be suspended until the required corrective actions are complete. The Lead auditor should develop an audit plan to be submitted to the auditee for approval before the audit (where allowed per regulations). The Plan should define the objectives and scope of the audit, identify the auditee’s management team having direct responsibility for the audit scope and purpose. Identify the applicable standards to be used, the Process(es), the lead auditor and audit team members, specify language of the audit, time frame and locations, all organizational units and areas to be audited, schedule meetings with auditee management, and identify who receives the final audit report (and when) (Crawford, 2017).
Audit Execution
Audit Execution begins with the opening meeting, including senior management. The purpose of this meeting is-
- Introduce the audit team
- Fully clarify the audit scope, objectives, plan, and schedule
- Review the methods and procedures to be used during the audit
- Confirm that the resources required for the audit are available
- Establish firm paths of communication
(Crawford, 2017)
Process Assessment begins with applicable elements of the process and quality system evaluated. Objective evidence is collected by:
- Interviewing and questioning personnel
- Reviewing records and documents
- Visually observing activities and conditions
An excellent little acronym for auditing is D.O. o R. S, representing doors to remembering types of audit evidence. D.ocuments or documented information are organizational policies, SOPs, WIs, drawings, or any other guidance document. O.bservations represents everything witnessed by the audit team. R.ecords are completed forms maintained, providing a historical record of organizational activity relative to the process. S.tatements include interview responses, explanations of procedures, or overheard conversations (Lance B. Coleman, 2015).
If possible, evidence collected via personal interviews should be confirmed by other methods. Any Documents or copies of records collected or any photos taken during the audit should be noted by the auditor and acknowledged by the auditee. Upon evaluation of the objective evidence collected, auditors must document their quality audit observations against the process.
Nonconformities (non-fulfillment of requirements per the process or regulations) and Observations that could become nonconformities should be reviewed as they are observed. The collected objective evidence must support any Nonconformity and identify what requirement has been violated.
A closing meeting should be held with the management and process owner, clearly defining all quality observations, nonconforming findings, and categorizing each finding by severity from Opportunity For Improvement, Minor NC, to Major NC. Positive comments should be noted, as well.
The Supervisor, Management, and all invited parties will, at this point, have an opportunity for a final discussion and then be presented with the list of observations, NCs, and feedback(Crawford, 2017).
Audit Report
The Audit Report is formal communication. The lead auditor will finalize the report based upon the overall objective evidence and the final discussion. Any NCs in the report should be very specific so the party being audited can more readily address the issue, and should include-
- Requirements of the internal or external standard
- Severity
- The required date for submission of a corrective action plan
Keep clear lines of communication open(Crawford, 2017).
Audit Completion
The audit should not be considered complete and closed until any associated corrective actions have been completed and communicated to the auditor. Auditing documents should be retained or destroyed by agreement between auditee and auditor. In the case of internal audits, process audits are much less formal, but this is a better opportunity for process improvement, so more rigorous process audits should be used internally (Crawford, 2017).
Conclusion
A well planned and executed audit should always be a friendly encounter. A process is not just an object to potentially find fault with but is usually the critical point of possible improvement in an organization. When auditing, be helpful to the auditee in pointing out Opportunities for Improvement -OFIs- (fresh eyes usually see most clear), and when being audited, do not be fearful of findings. When the finding is justified, accept it and act upon the finding, correct the issue, and as often as possible act upon the OFIs as well.
Processing…
Success! You're on the list.
Whoops! There was an error and we couldn't process your subscription. Please reload the page and try again.
Bibliography
Crawford, H. (2017). The Biomedical Quality Auditor Handbook. Milwaukee, WI: Quality Press.
Kubiak, T. a. (2017). The Certified Six Sigma Black Belt Handbook Third Edition. Milwaukee: ASQ Quality Press.
Lance B. Coleman, S. (2015). Advanced Quality Auditing. Milwaukee, WI: ASQ Quality Press.

Visual Management vs The Hidden Factory

The Usual Tools-
- 5S/6S Production Boards (Preferably Electronic for ease of update)
- Schedule Boards/Production leveling
- Tool Boards
- Andon lights/boards
- Kanban System (Pull System)
- Floor Markings/Color Coding
The most common Visual Management methods in factories have been around for quite a while. Providing Management and those being managed with a way to quickly and visibly understand what is happing now and what needs to happen next traces back to military visual standards and Naval flag signals.
Visual communication is the one of the most universal ways of communicating a large amount of information quickly, and the current visual methods could be considered very similar to the ones the original military mindsets used so long ago.
The original Toyota Way has two key pillars- JIT (Just In Time mfg.), and Jidoka (Automation with human intelligence, because work stops immediately when a problem first occurs. This leads to improvements in the processes that build in quality by eliminating the root causes of defects). In War, everything has to be Just in Time, and you don’t keep throwing your troops at the same problem even when you keep losing the battle. You stop and figure out the root cause of your previous loss before you move from a defensive posture.
Visual Controls (if implemented with the correct culture) are excellent management tools.
One of the common cultural issues is the “punishment culture”. When employees are punished/chastised for reporting process failures, quality improvement is not likely to occur, as the factory will become a “Hidden Factory.”
In the Classic “Hidden Factory” Scenario, every department is in its silo and reporting only vertically.
Central Management gets the data funneled to them (but rarely walks the process actively). Few want to admit when something goes wrong, so things they see as inconsequential are omitted. Everyone turns in sterling reports, but the bottom line always suffers. Examples: Rework time, scrap costs, internal investigation costs, customer complaint investigation costs, Re-scheduling costs.
There are a host of visual Controls that can be used in a Lean (or just a practical) workplace to help combat the communications barriers common to factories. The first and most crucial step is a culture change from the top down with full buy-in from the employees before a large-scale implementation can begin. Once the employees are confident they will not be chastised for speaking up about what is wrong internally with the processes, then the implementation can begin (Kubiak, 2017) (CSSBB Primer, 2014).
The Basic Visual Controls to implement are (based upon need):
- 5S/6S
- Sort (Seiri)
- Separate the needed from the unneeded items in the workplace, discarding all unnecessary items
- Set/Straighten (Seiton)
- Arrange in an orderly way- A place for everything and everything in its place (labels and shadow boards are frequently employed at this phase)
- Shine (Seiso)
- Clean and wash the work area
- Standardize (Seiketsu)
- Creation of and regular performance of the first 3 Ss
- Sustain (Shitsuke)
- Discipline to maintain the first four Ss
- The 6th S is emphasized more and more: SAFETY
- Safety should be an emergent property of 5S. Still, sometimes it is not, so safety has been often added to be sure it is addressed, and particular emphasis on safety usually improves job safety overall.
- Sort (Seiri)

5S Will not magically reveal the Hidden Factory (though it will hint at it), but it does help provide the foundation of readiness, safety, discipline, and accountability required. Having the entire workforce learn to maintain their area and be responsible for sustaining the effort is one of the first steps toward a culture of success.
- Production Boards (Preferably Electronic for ease of update)
- Production Boards give an “at a glance” idea of where jobs are, what is coming, what went wrong, and allow everyone to see the outcome without any hidden factory effect (if the culture is correct). Regular and disciplined or automated updates are required, and two-way communication with the floor team during regular meetings at the production board (huddles) is the most effective way to identify possible points of improvement to supervisors so they can assign teams to deal with the issue. It is always best to train floor personnel to solve problems with critical thinking skills rather than trying to direct the entire factory.
- Schedule Boards/Production leveling
- Heijunka Boards can provide clear communication for how the production load is to be smoothed out.
- Unexpected bottlenecks because of unexpected material shortages or constraints due to planning are much less likely if the entire plan is visible to the whole of the factory. Deviations that cause a problem can be addressed, and the need to level the load due to demand is part of the built-in process.
- Tool Boards
- Tool boards will emerge from a 5S program, creating shadow boards to identify any missing tools (an excellent antidote to the disease of not telling anyone that a needed tool is missing). These boards also help shorten cycle times by reducing the time necessary to find tools.
- Andon lights/boards
- Andon Lights usually are green while the workstation is running with no problem. When a sensor detects a problem (or a person manually stops the process), the light shifts to red to signal everyone of machine downtime, a quality problem, tooling issues, operator problems, or material shortages or jams in the process. More sophisticated systems use an electronic board that communicates what the problem is (and where it is) to the entire factory so that the needed people can respond ASAP. Andon lights/boards are an aspect of Jidoka.
- Kanban System (Pull System)
- A visual signaling system (usually using Kanban cards) used to control the flow of inventory in a “pull” system. Kanban controls the flow of WIP and finished goods into and out of “supermarkets,” lines, and production cells. A production Kanban indicates the number of parts needed to replenish what has been consumed (usually rectangular). A withdrawal Kanban shows the number of parts removed from the “supermarket.” A signal Kanban is a type of withdrawal Kanban that triggers production when the minimum amount of containers has been reached (often Triangular). Kanban systems can get much more complicated but are much more effective than traditional inventory management if implemented correctly with the correct cultural mindset in place within the organization.
- Floor Markings/Color Coding
- Markings and color coding are used to indicate flow direction. In a traditional factory tracing the path would look insane. Still, when the machine paths are laid out in the most efficient pathway and marked so that there is no confusion, Cycle times are significantly reduced, and one of the Major Wastes of unnecessarily transporting material is alleviated (Lean Enterprise Institute, 2014) (CSSBB Primer, 2014) (Kubiak, 2017).
Conclusion
When the culture is defensive and non-communicative between departments, only a few at a time know just a portion of what is happening at any one time, and employees are waiting to see what the punishment for the process going wrong is, then the Hidden Factory rules. When communication is openly shared and put on full visual display, and problems are discussed and tackled with minimal regard for rank in a cross-functional way as soon as they arise, good things begin to happen. Those who understand the processes best solve the problems, using visual cues and logic (not commands from supervisors) to run the factory and address problems. The Hidden factory can be significantly reduced by open communication and being willing to face the negatives rather than pretend those negatives do not exist.
REFLECTION: FOR STUDENTS: Is the culture currently conducive to learning to be manager or boss? How do you think the culture you are learning in will help you become more of a coach and less of a boss?
FOR ACADEMICS: Is teamwork being taught purely from a results perspective or from a coaching perspective (to help the students learn critical thinking and problem solving)?
FOR PROFESSIONALS/PRACTITIONERS: Culture eats Strategy for breakfast (a phrase originated by Peter Drucker). No Strategy however brilliant can overcome a culture of fear. Cultural change is the foundation of Quality improvement and must always be attended first, or the attempted QI initiative will be taken down due to resistance to change created by a feeling that a “new culture” is trying to usurp it’s place. For this reason, the culture of change has to cascade from the top down, and buy-in at every level must occur, with cultural buy-in moving to the next level down only after each level is fully (or vast majority) bought in.

Processing…
Success! You're on the list.
Whoops! There was an error and we couldn't process your subscription. Please reload the page and try again.
Bibliography
CSSBB Primer. (2014). West Terre Haute , Indiana: Quality Council of Indiana.
Drucker, P. (1954). The Practice of Management. New York City: Harper & Row.
Kubiak, T. a. (2017). The Certified Six Sigma Black Belt Handbook Third Edition. Milwaukee: ASQ Quality Press.
Lean Enterprise Institute. (2014). Lean Lexicon. Cambridge, MA: Lean Enterprise Institute.

The 7 New Quality Tools

The Seven New Management and Planning Tools
If you have had any formal training in Root Cause Analysis, Problem-solving, or any type of Quality Improvement, then the seven basic QC tools have most likely been taught to you rigorously (See Blog Post https://qualityconcepts.home.blog/category/7-basic-quality-tools/). While the seven tools are sufficient for problem-solving, they are not ideal for management and planning. The need for an expanded toolset was noticed and addressed in 1976 by the JUSE (Union of Japanese Scientists and Engineers) to promote innovation, communicate information, and successfully plan major projects. A JUSE team presented 7 New Quality tools (sometimes called the Seven Management and Planning -MP- tools): Affinity Diagram, Relations Diagram, Tree Diagram, Matrix Diagram, Matrix Data Analysis, Arrow Diagram, and Process Decision Program Chart (PDPC). Often in the modern world, the more complex Matrix Data Analysis is replaced with the similar Prioritization Matrix, so I will cover the Prioritization Matrix rather than the less commonly utilized Matrix Data Analysis tool.
The New Tools were exported to the United States in the mid-1980s and have become standard project management tools in the U.S. and internationally. Not all of these tools were new by any means, but the way they were presented was effective (Tague, 2005).
New Tools:
Affinity Diagram
Relations Diagram
Tree Diagram
Matrix Diagram
Prioritization Matrix
Arrow Diagram
Process Decision Program Chart (PDPC)
Affinity Diagram
Created in in 1960’s by Japanese anthropologist Jiro Kawakita, the Affinity Diagram is a method that organizes a large number of ideas into logical and related groupings.
When to use-
This tool is one of pure abstract analysis, and therefore very useful at multiple points in the process. Whenever your team is overwhelmed with a large number of facts or ideas presented in a chaotic manner, this would be a good time to employ this tool. When the issue(s) seem too large and complex for the team to understand what is usually needed is for the team to see the underlying pattern. Once again, this is an excellent tool. When a team is trying to come to a consensus, this tool helps the team work together to agree upon how the available facts relate to each other.
How to use-
- The most efficient methodology is to utilize a large work surface (wall or whiteboard), sticky notes, and markers.
- Each separate Idea is recorded on a separate note, and all notes are spread out randomly so that everyone can see each note.
- During the next step the team should remain silent, sorting the ideas out into groups (with no category headings). 5-10 is the standard number of groupings but this is dependent upon the complexity of the situation. The team should continue to move the items around (writing multiple notes if it seems they fit into more than one group) until the team has grouped all notes. It is Ok to have “loners” that do not fit any particular group, or for a note to be moved once it has been placed.
- The Team can begin discussion at this point- The shape of the chart, surprising patterns, and why notes were moved between different groups by different people. Some more changes can be made here, and when the groupings are finalized, select a heading for each group.
- Combine groups into Supergroups if the project complexity warrants (Tague, 2005) (ASQ, n.d.).

Relations Diagram
The original term was Relations Diagram, also called: Interrelationship diagram, Interrelationship digraph, network diagram, or matrix relations diagram. This tool is designed to show cause-and-effect relationships while helping a team evaluate the natural relationships between the different nuances of a complex situation.
When to use-
While trying to understand relationships between Cause-and-Effects such as:
- Trying to ID an area of greatest impact for improvement
- During analysis of a complex issue for causes
- During implementation of complex solutions
- As a follow up step to an Affinity Diagram, C&E diagram, or Tree Diagram to more thoroughly explore relationships
How to use-
Gather these basic materials: Sticky notes, large paper surface, markers, and tape.
- Define the issue to explore on a sticky note and place it at the top of the work surface
- Brainstorm ideas about the issue and write them on notes. If another tool was used, then obtain ideas from the affinity diagram, lowest level of the tree, or final branches of the fishbone diagram.
- Place one idea at a time on the work surface and determine if the idea is related to any others. Place new ideas near related ideas leaving room for drawing of arrows later. Repeat until all ideas have been transferred to work surface. Determine how each idea causes/influences other ideas. Draw arrows from each idea to the ones it causes or influences.
- Analyze the diagram
- Count the Arrows in and out for each idea and record at the bottom of each box. The ones with the most arrows are the key ideas.
- Note which ides have mostly outgoing arrows- These are basic causes.
- Note which ideas have mostly incoming arrows- These are final effects that may be critical to deal with.
- Double check that some ideas with fewer arrows may be key as well. (the number of arrows is just an indicator) Draw bold lines around key ideas (Tague, 2005) (ASQ, n.d.).
Tree Diagram
The Tree Diagram progresses from one event/goal and cascades downward in a spreading system of branches made of possible causes/paths. The tree diagram is useful in many different aspects, including CTQ translation, Decision making process mapping (Decision Tree), Fault tree analysis (root cause analysis), Work Breakdown Structure, and Countermeasure tree.
When to use-
- When a known issue is known at a general level and more specific details are needed
- When determining steps required to achieve a goal or actions required to reach a solution
- Detailed process analysis
- Root Cause Analysis
- Evaluating best solution among many potential
- When a clear communications tool is needed
How to use-
- Develop statement for goal, project, plan, problem, or issue that is being studied.
- Ask a question to help determine the next level of detail, such as
- How can this process be completed in the most efficient way?
- Why did this occur?
- What are the pieces of the whole?
- Brainstorm all possible answers (works best with cross-functional team). If other tools have provided information, utilize them.
- Tree can be horizontal or vertical. Write each tier of idea in a line and connect it with the idea above it. Show links between tiers with lines/arrows. Confirm all items in a tier are needed for the tier above it, determine that all items in the tier would be sufficient.
- Every new Tier becomes the next “goal tier” and continue until the tier has reached the fundamental elements, and the contents of the diagram can be logically confirmed as needed and sufficient from objective to fundamental elements (Tague, 2005) (ASQ, n.d.).

Matrix Diagram
The Matrix Diagram helps to demonstrate relationships between multiple groups of information. It can provide information about the relationship, including Strength, role played, measurements, etc. There are six different Matrices possible: L-, T-, Y-, X-, C-, and roof-shaped, depending on how many groups there are. This tool is very generic and may be adapted broadly.
When to use-
- When attempting understand how groups or groups of items interrelate to one another
- When conveying how groups or groups of items interrelate for the sake of clear communication
- An L-Matrix relates two groups of items to each other (or one group to itself)
- A T-Matrix relates three groups- A relates to B, A relates to C, but B does not relate to C
- A Y-Matrix relates three groups with each group related to the other two circularly: A to B, B to C, C to A
- A C-Matrix relates three groups simultaneously
- An X-Matrix relates four groups of items, with each group related to two others circularly A to B to C to D to A, but not A to C or B to D
- A roof-shaped Matrix relates one group to itself, usually used with an L- or T-Matrix
How to use-
- Isolate groups to be compared
- Choose the appropriate matrix format
- Create Grid
- use row labels and column headings for item groups
- Determine what information needs to be displayed with the symbols on the matrix. Create a legend (strong/weak/moderate for example)
- Compare groups item by item, marking appropriate symbol at the matrix intersection of paired items
- Analyze Matrix for patterns and repeat as desired with a different format to learn more (Tague, 2005) (ASQ, n.d.).
This is a complex tool so for further explanation I would direct you to the ASQ Resources link that will more thoroughly answer any questions you have.

Prioritization Matrix
The Prioritization Matrix is a L-Shaped matrix that compares a list of options/needs to a set of criteria, in order to help choose the best options when too many options are available, or to set the options in order of priority. This is an extremely rigorous method and can be quite time consuming when performed properly as a cross-functional group.
How to Use-
- Determine your criteria and rating scale.
- Establish criteria weight.
- Create the matrix.
- Work as a team to score options based upon weighted criteria.
- Discuss results and prioritize your list (Tague, 2005) (ASQ, n.d.).

Arrow Diagram
The Arrow Diagram is a very powerful project planning tool. The Arrow Diagram has evolved over time and as project management has become more prominent. Some of the terms used to describe an arrow diagram are: Activity Network Diagram, Network Diagram, Activity Chart, node diagram, CPM -Critical Path Method- Chart, and PERT -Program Evaluation and Review Technique- chart.
I will only be addressing the higher-level aspects of the arrow diagram. The base materials needed are Sticky notes, markers and a large paper writing surface (such as brown paper).
When to use-
- When organizing and scheduling tasks for a complex project/process with a specific goal
- When you already know the individual steps of the project, their required sequence, and the length of time each step will take to complete
- When the project schedule is critical, and missing the deadline could be a major negative, or completing the project early due to good time management would provide positive returns.
How to use-
- Write out all tasks in the project or process on a sticky note, placing and arrow under the project task pointing to the right.
- Sequence the tasks.
- Which tasks must happen before the previous one can begin?
- Which tasks can be done at the same time?
- Which tasks should happen immediately after each task?
- Diagram the network of tasks. Arrange them in sequence on a large piece of paper. Time should flow from left to right and concurrent tasks should be vertically aligned. Leave space between the notes.
- Between each two tasks, draw circles for “events.” An event marks the beginning or end of a task and can help visually separate tasks.
- When the network is correct, label all events in sequence with event numbers in the circles.
- Determine task times—the best estimate of the time that each task should require. Use one measuring unit (hours, days, or weeks) throughout, for consistency. Write the time on each task’s arrow.
Determine the critical path (the longest path) from the beginning to the end of the project by summing all of the potential paths from beginning to end of project. Mark the critical path with a heavy line or color. (Tague, 2005) (ASQ, n.d.)
Process Decision Program Chart (PDPC)
This tool is a version of the tree diagram that is designed to identify all that might go wrong in a plan being developed. Utilizing PDPC allows the team to create Countermeasures for those possible failures, or the plan can be outright revised to eliminate those failure possibilities.
When to use-
- Before full implementation of a plan
- When the plan is complex
- When completion of the plan on schedule is critical
- When failure has high repercussions
How to use-
- Develop a high-level tree diagram of the plan or process using at least three levels and one main objective at the top of the tree
- Brainstorm all that could go wrong at current lowest level
- Review the problems, and as a team eliminate the highly unlikely items or those with minimal impact to the plan/process. Create a new lower level from these remaining problems linked to the tasks
- For each problem brainstorm countermeasures and prepare contingencies for the plan/process problems. Countermeasures are recorded on the next level.
- Decide upon practicality of countermeasures using criteria like cost, time, ease of implementations, and effectiveness. Mark the impractical countermeasures with an X and the practical with an O (Tague, 2005) (ASQ, n.d.).

Conclusion
Granted, these tools do not always have to be used in order to plan and manage a successful project. The primary reason these tools were conceived was to foster better team communication and team analysis. I would consider the team leader who fails to use methods that have been proven over time to improve outcomes a leader who does not lead with innovation, or even best practices, and who could be putting projects at risk.
REFLECTION: FOR STUDENTS: Are you challenging your team members to properly address the assignment given to your team by using management tools, rather than the dreaded “lay it all on those who will do the work” behavior, and cognizant of how that will impact your behavior as a future manager?
FOR ACADEMICS: Is the teamwork methodology commonly used in higher learning representative of real world Project Management?
FOR PROFESSIONALS/PRACTITIONERS: These tools can initially be cumbersome to implement, but they are good instruments to help break the silo mentality. Communication is the key to cross-functional success.

Processing…
Success! You're on the list.
Whoops! There was an error and we couldn't process your subscription. Please reload the page and try again.
Bibliography
ASQ. (n.d.). THE SEVEN NEW MANAGEMENT AND PLANNING TOOLS. Retrieved from ASQ Resources: https://asq.org/quality-resources/new-management-planning-tools
CSSBB Primer. (2014). West Terre Haute , Indiana: Quality Council of Indiana.
Kubiak, T. a. (2017). The Certified Six Sigma Black Belt Handbook Third Edition. Milwaukee: ASQ Quality
Tague, N. R. (2005). The Quaity Tool Box. Milwaukee: Quality Press.
The Technology for Industry 4.0 is Here, but Quality 4.0 is at 3.0 Going on 4.0 (With Still More Growing To Do)!

REFLECTION: FOR STUDENTS: Are the current Management frameworks you have been taught sufficient for Industry/Quality 4.0, or will you have to shift your perspective to be viable?
FOR ACADEMICS: Are you teaching two years behind (as is common with textbooks) or are you also including the coming impact of Quality 4.0 and disseminating that required knowledge to your students?
FOR PROFESSIONALS/PRACTITIONERS: Always focus maintaining and improving on the current state, but plan for the achievement of the future state or the future state will never be realized.
Industry 4.0
For many years, the quality culture has been the lighthouse that lit the way down the path, guiding industry toward the reduction of waste and higher levels of customer satisfaction and retention, but things have been evolving. Industry has gone through many changes, and those changes always have required Quality to adjust.
Industry revolution 1: machine manufacturing, steam power, and the migration to city living for people who had previously been agriculturalists. (Quality moved from guilds into the role of inspection)
Industry revolution 2: The production line and mass manufacturing drastically reduced the cost of consumer and industrial products. (Quality developed more efficient quality management tools)
Industry Revolution 3: Barely a revolution, but significant. Electronics and control systems have gradually penetrated manufacturing, allowing greater flexibility and more sophisticated products at a significantly lower cost until ERP and PLM have become the standard. (Quality began to utilize data to analyze costs/customer complaints and reduce enterprise costs due to quality failures)
Each industrial revolution brought about new patterns of quality management. As Deming emphasizes, if the industrial culture is not Quality-oriented, it will ultimately displease the customer. Still, right now, the fourth industrial revolution is upon us, and Quality, though fully aware of the future state goals, is still working on perfecting the foundations of Quality 3.0. At the same time, Industry 4.0 is off and running.
Industry 4.0 consists of Many critical technology changes and advancements that have enabled technology to become more predictive and communicative, including advances in data, analytics, connectivity, scalability, and collaboration. The digital impact of the third revolution is magnified dramatically. It evolves industry into a phase where AI helps solve problems proactively rather than picking through the past failures to figure out what went wrong. This phase will touch every aspect of industry, connecting people, machines, and data in new ways, and provides access to technologies that were previously only accessible to a skilled few and heralds transformative capabilities such as those in material science and 3D Printing.

Adapted from Quality 4.0 Impact and Strategy Handook
What is Quality 4.0?
These are the primary axes of Quality 4.0 I want to discuss:
- Data
- Analytics
- Connectivity
- Collaboration
- Scalability
- Management Systems
- Compliance
- Culture
The effect of the implementation of these technologies is essential to quality because they allow for the transformation of culture, leadership, collaboration, and compliance. Quality 4.0 is genuinely not about technology, but the users of that technology, and the processes they use to maximize value. Quality 4.0 doubtlessly includes the digitization of quality management. It is more important to consider the impact of that digitization on quality technology, processes, and people. Quality 4.0 should not be sold as a buzzword system to replace traditional quality methods, but rather as a framework designed to improve upon the practices already in place. Manufacturers should use the 4.0 framework to interpret their current state and identify what changes are needed to move to the future state (just like any traditional CIP project), but do not let the daunting task of implementation scare top management away.
Data:
Deming said it best: “In God we trust, all others must bring data.” Data has been driving quality decisions, change, and improvement for a very long time and Evidence-based decision making has become less an anomaly and more the standard. Still, industry has a long way to go toward fully integrating the quality culture. As can be seen in the chart, a portion of the more mature companies have mastered traditional data and have begun leveraging big data. However, the struggle is still genuine and not yet a true cohesive culture across all areas internally or across industries.

Data has five critical elements that must be captured from a practical and cultural perspective-
VOLUME: Traditional systems have a large number of transactional records (e.g., corrective and preventive action (CAPA), NCRs, Change Orders, etc.). The volume of data from connected devices is many orders of magnitude more significant and will continue to grow, requiring specialized approaches such as data lakes, and cloud computing
VARIETY: Systems gathers three types of data: structured, unstructured, and semi-structured. Structured data is highly organized (CAPAs, quality events). Unstructured data is un-organized (e.g., semantics data, data from sensors, and connected devices). Semi-structured data is unstructured and has had structure applied to it (e.g., metadata tags).
VELOCITY: This is the rate at which a company gathers data.
VERACITY: This refers to data accuracy. Quality system data is often low fidelity due to fragmented systems and lack of automation.
TRANSPARENCY: The ease of accessing and working with data no matter where it resides or what application created it.
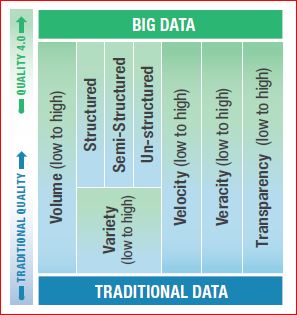
Analytics:
Analytics are the tools that reveal what the terabytes of data can tell us. Unfortunately, quality often stumbles over analytics. 37% of the market identifies weak metrics as a top roadblock to accomplishing quality objectives. Because there is insufficient adoption of real-time metrics by most of the market, we are often acting on the past, not the current situation.
Analytics fall into four categories- Descriptive (number of open quality events), diagnostic metrics (quality process cycle times to identify bottlenecks), Predictive metrics such as trend analysis (application of trend rules to SPC data), and Predictive using Big Data analytics, or Machine Learning (ML)/AI to traditional data or Big Data (predicting failures of a specific machine or process).
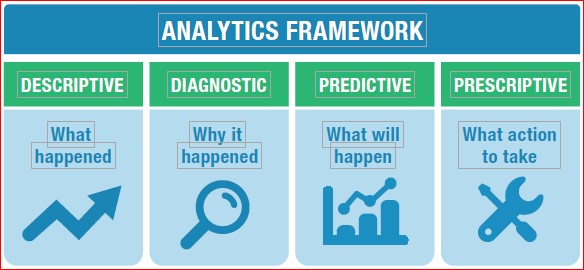
Companies attempting to achieve Quality 4.0 should construct their analytics strategy after or concurrently with their data strategy. Powerful analytics applied to low veracity data will only provide low veracity insights.
Connectivity:
“Connectivity” in the modern industrial age is the cascading multi-direction connection between business information technology (IT) and operational technology (OT), enterprise quality management system (EQMS), enterprise resource planning (ERP), and product lifecycle management (PLM), with OT at the level of technology used in laboratory, manufacturing, and service. Industry 4.0 transforms connectivity through a proliferation of inexpensive connected sensors that provide near real-time feedback from connected people, products and edge devices, and processes.
- Connected people can leverage personal smart devices or intelligent wearable devices that sense workers or their environment. The Connected worker programs usually have goals of increased efficiency and safety.
- Connected products can provide feedback on their performance across their lifecycle.
- Connected edge devices efficiently connect sensed equipment. Edge devices often perform analytics at the device, helping to make predictive/prescriptive decisions (shut this machine down and come for repair), and decide which data to send to central OT systems.
- Connected processes provide feedback from connected people, products, and equipment into processes. This broad element of connectedness allows for the overall reduction of the decision process by providing accessible data and reliable analytics
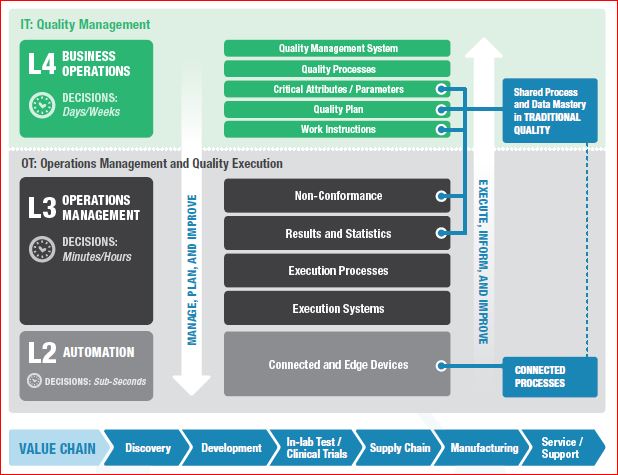
Collaboration:
Quality management requires collaboration. Quality is inherently cross-functional and global. With the help of digital messaging (email, IM), automated workflows, and online portals, companies execute traditional quality business processes. Much of the market has yet to take advantage of automated workflows and portals, while only 21% have adopted a core EQMS.
Collaboration is a powerful fuel for innovation and quality improvement and has been profoundly transformed and magnified by connectivity, data, and analytics. Leaders should consider how they collaborate and build a secure and reproducible data sharing strategy that meets objectives such as better competency, more streamlined oversight, improved security, and auditability. The approach of collaboration is often part of the culture, and reproducing it can be difficult.
Scalability:
Scalability is the ability to support data volume, users, devices, and analytics on a global scale. Without a global scale, traditional quality and Quality 4.0 are not nearly as effective, and a company is unable to harmonize processes, best practices, competencies, and lessons learned corporate-wide. Thirty-seven percent of companies struggle with fragmented data sources and systems as a top challenge in achieving quality objectives. Scalability is critical to Quality 4.0
Management Systems:
The EQMS is the Center of all quality management connectivity and provides a scalable solution to automate workflows, connect quality processes, improve data veracity, provide centralized analytics, ensure compliance, and foster collaboration within a universal app. It is a hub because quality touches every part of the value chain and how it’s managed. Over the last 50 years, business has slowly realized that quality was not the bad guy but was, in fact, the helping hand to allowing us to have the capacity to remove much of the hidden factory.
There has been some progress on EQMS adoption, but many companies are still critically lagging. Even those that adopt EQMS have not utilized it in an integrated fashion. Only 21% of the market has adopted EQMS, and of those, 41% have adopted a standalone unintegrated approach, leading to fragmentation. Fragmented core processes and resistance-to-change create the current situation. While CAPA/non-conformance is globally harmonized at 25%, 36% of manufacturers have not harmonized any processes, and the median harmonization rate of a single process is an abysmal 8%
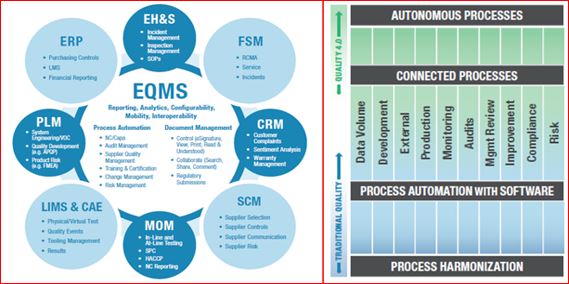
Compliance:
Compliance would include conforming to regulatory, industry, customer, and internal requirements. Life science manufacturers/ have a particularly heavy compliance burden, but many other sectors are even more burdened by compliance with regulations. Compliance is essential to quality teams across all industries since quality often takes a lead role in ensuring that processes, products, and services not only conform with requirements but are safe for the public. Manufacturers already leverage technology in every way possible to help reduce the cost and effort to comply (work smarter, not harder). Initial attempts at implementation of compliance technology required considerable custom code to address requirements. While helping to achieve compliance, custom code was difficult to upgrade and revalidate. This result was often known as “version lock,” where companies chose to delay upgrades by many years to avoid the cost and effort of migrating and revalidating code and data.

Quality 4.0 provides further opportunities to automate compliance. Active real-time collaboration offers a mechanism to share successful and failed approaches to compliance across groups, sites, and regions. Analytics can be used to implement internal alerts and preventative measures for organizations to automatically address potential compliance breaches or act to prevent the violations. Integrated IT/OT data models and/or collaboration technologies like blockchain can provide a data-driven approach that automates auditability.
Culture:
Leaders should feel the drive to develop a Culture of Quality since Quality often owns the ultimate responsibility for process execution with insufficient cross-functional participation and ownership from other functions. A company that has “a Culture of Quality” exhibits four key elements: process participation, responsibility, credibility, and empowerment. Companies need to set goals for cross-functional process participation, cross-functional responsibility for Quality, credibility for Quality and its work across functions, as well as cross-functional empowerment. In traditional settings, achieving all of this concurrently can be quite tricky, in part due to regulatory burden, weak metrics and metric visibility, fragmented data systems and sources, (not to mention fragmented processes). Quality often presents itself to employees as a giant maze of regulation and rules; more like the “quality police” than CIP. Only 13% of cross-functional teams clearly understand how Quality contributes to strategic success. Quality 4.0 can make a culture of Quality much more attainable through better connectivity, visibility, insights, and collaboration. Connected data, processes, analytics, apps, etc., will help to improve the Culture of Quality through shared/connected information, insights, and collaboration. Quality 4.0 makes quality processes and outcomes more visible, connected, and relevant. Community is the primary component of Culture.

Conclusion
Manufacturers looking to improve quality should assess where they stand on each of the key Axes of Quality 4.0 and prioritize investments for the long term. Given the current state of Quality in the market, it is probable that many companies will find themselves required to make investments first in traditional quality before they can fully become part of Quality 4.0. If the foundation (Quality 3.0) is not yet fully developed, any company would be foolish to build on shifting soil.
There are clear interrelationships among the axes, and any company that is willing to add new capabilities to individual axes enables new applications on others. Quality 4.0 makes critical new technologies affordable and accessible, and the story of Quality 4.0 is really about the application of these technologies to solve long-standing quality challenges and to reoptimize to provide novel solutions. Quality 4.0 is real, gaining momentum, and inevitable. Quality leaders should prioritize Quality 4.0 plans. Those that stay on the sidelines are at a high risk of being left behind- but follow the right game plan and don’t fall for buzzword packaging that promises “a new kind of quality.” You will have to invest but invest in yourself, and with those who genuinely know Quality. If you do not, those executives eager for a quick financial return will ok the “solve all your problems” fix solicitors try to sell you. When it fails, the natural resistance to organizational change will kick in double and it will be even harder to convince anybody that the change is worth re-initiating. “Do It Right The First Time” (-John Wooden)
The paper I got the most comprehensive information from was QUALITY 4.0 IMPACT AND STRATEGY HANDBOOK (from LNS Research), which detailed 11 axes of quality. Still, I only addressed the 8 I felt were pertinent to most quality professionals, but the link to the white paper can be found in the bibliography. I would recommend the Handbook if you need a more detailed evaluation of Quality 4.0 and future requirements (Dan Jacob, 2017).
Processing…
Success! You're on the list.
Whoops! There was an error and we couldn't process your subscription. Please reload the page and try again.

Bibliography
ASQ. (n.d.). The History of Quality. Retrieved from https://asq.org/quality-resources/history-of-quality
Dan Jacob. (2017). Quality 4.0 Impact and Strategy Handook. Retrieved from https://www.sas.com/content/dam/SAS/en_us/doc/whitepaper2/quality-4-0-impact-strategy-109087.pdf
George Mason University. (2014). Mercatus Center. Retrieved from https://RegData.org
