What is an A-3 Report?

REFLECTION: FOR STUDENTS: “Having no problems is the biggest problem of all.”- Taiichi Ohno
FOR ACADEMICS: “Data is of course important in manufacturing, but I place the greatest emphasis on facts.”- Taiichi Ohno
FOR PROFESSIONALS/PRACTITIONERS: “Make your workplace into showcase that can be understood by everyone at a glance.”- Taiichi Ohno
Foundation
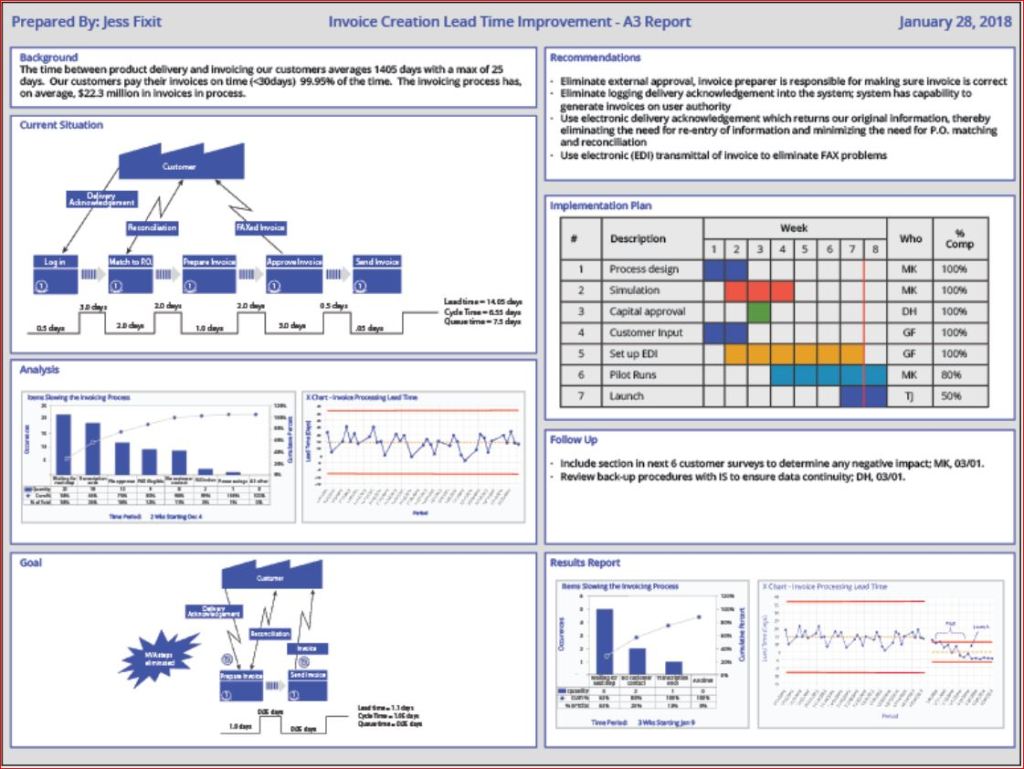
The A3 Report is a model developed and used by Toyota and currently used by many businesses around the world. The A3 Report is named for a paper size-A3 (29.7 x 42.0cm, 11.69 x 16.53 inches). The entire current state and PDCA aspects of the project are captured visually for easy communication and reference. When CIP projects use an A3 methodology to track projects, it has been demonstrated that clear visual communication helps the team members and the overall organization be more aware of the team’s progress.
A minor improvement event, in my experience, is generally four weeks to six weeks. Still, when an issue needs to be addressed thoroughly, the organization must be willing to invest more time and resources. Almost every moment of improvement time spent may be wasted if the true root cause is not adequately addressed due to failure to properly invest resources. There are four distinct phases: 1) preparation and training; 2) process mapping and current state analysis; 3) process mapping and future state analysis; and 4) implementation and ownership. I will put up a basic template below and walk through the A3 report.
Example

- Clarify the Problem
- IS/IS Not Analysis-excellent first tool to use to define the scope of the problem.
- After the scope of the problem has been defined, define the problem relative to the organization or process. The focus should always be on an underlying process or systematic issue, not an individual failure. Systematic failures are frequent but can be corrected with teamwork. The problem statement should never include a suggestion for a solution.
- Breakdown the Problem
- Clearly define the problem in terms of the 5 Why’s and 2 W’s (Who?, What?, When?, Where?, Why? And How?, How much or often?
- Set goals for improvement towards the ideal state vs current state
- Team sets S.M.A.R.T. goals relevant to block 1 state, establishing the end improvement target
- Root Cause Analysis
- Team uses focus areas from block 2 to determine Root Cause(s) employing relevant RCA tools
- Common RCA tools
- Cause-Effect/Fishbone Diagram
- 5 Why Analysis
- Fault Tree Analysis
- Pareto Chart
- Clearly state the determined root cause(s) and display the output of the tools
- Develop Countermeasures
- The team should take the root cause/causes from Block 4 and assign specific countermeasures.
- Countermeasures should directly address the root cause and, in theory, should solve the problem identified in Block 1.
- The completed fifth block is populated with any tool that will outline the countermeasures.
- Implement Countermeasures
- The team tracks the countermeasures from Block 5 and ensures each one is accomplished.
- The completed sixth block should be populated with the tool used in Block 5 to outline the countermeasures and updated as each is accomplished.
- Monitor Results and Process
- Effectiveness Check of Countermeasures
- Before/After Analysis
- SPC Control Charts
- Use Data from block 1 to determine if countermeasures from block 5 are having the desired effect relative to the target.
- If countermeasures are not effective, go back to RCA-block 4 (PDCA) and reconvene.
- Use the tool from block 6 to track countermeasure as ineffective in Block 7
- Effectiveness Check of Countermeasures
- Standardize successful processes
- If countermeasures are effective-
- Standardize all successful processes and note successful countermeasures as Standardized as they are approved using the tool from block 6 in Block 7
- A separate block can be used for Standardized processes
- If countermeasures are effective-
Conclusion
A complete A3 report can use many different tools, depending upon the problem being examined, so don’t fall into the habit of always using the exact same format. Be certain all four phases are completed. Innovation comes from creativity, so leave behind SOPs that demand exact clones of past reports. You may be dealing with a problem no person in your organization has yet to encounter, so outside of the box is thinking should always be on the table (Not locked away in a closed mind)

Processing…
Success! You're on the list.
Whoops! There was an error and we couldn't process your subscription. Please reload the page and try again.


Bibliography
Quality Management Journal, Volume 16, 2009 – Issue 4
Published Online: 21 Nov 2017
Quality Progress Volume 49, 2009 – Issue 1
Jan 2016

8D vs PDCA & DMAIC
REFLECTION: FOR STUDENTS: Are you using critical thinking or using a paint by the numbers method to solve problems?
FOR ACADEMICS: Are you providing your students with the tools needed to distinguish between “guidelines” and mandates?
FOR PROFESSIONALS/PRACTITIONERS: Is your organization allowing you find the true root cause of an issue or forcing you to fill out a form within a certain time frame? Try to convince top management to allow teams to properly explore root causes, and if management continues to violate standards by ignoring the concept of due diligence in favor of meeting the closure rate when more time should have been allotted- file a CAPA. It is your duty as a Quality Professional.
What is 8D?
I have been performing CAPAs for many years. I have employed many methods: The Tried and True PDCA, the DMAIC approach, and even utilized the A3 path when the visual display of ongoing CAPAs was critical to communication (or mandated by policy). The Eight Discipline (8D) Approach has been the path that was least used by me, as it was (to me) least flexible. For those who are proponents, it works fine, but it seems more about CAPA closure by the numbers and documentation than it is about teaching your team to be independent critical problem solvers. While 8D will work well in any industry if implemented correctly, 8D is more template-based than PDCA. Have no doubt, DMAIC is quickly becoming template-like via software applications. A basic template is a useful guide, but the less controlled the problem solving, the more likely the team is to arrive at an innovative solution.
For those who are unsure what the Eight Disciplines are, let me elaborate on the Eight Disciplines:
Originally Ford developed the 8D method in the late 80s, and it spread to most of the automotive industry.
The Ds in this method are not acronyms (as many seem to struggle with), but rather a set of “Disciplines” to follow for problem-solving. These Disciplines were widely transferred to “forms” that became “8D Forms”, used for root cause analysis and correction of problems with unknown causes.
8D Method
- D0- Plan for solving the problem and determine resources needed
- Before 8D analysis begins, proper planning will always translate to a better start.
- SME Input
- Collect data on issues
- Identify any need for an Emergency Response Action (ERA)
- D1-Use a Team
- Choose the right type of team, right team members
- Teams require proper preparation.
- Set the ground rules
- 8D must always have two key members: a Leader and a Champion / Sponsor
- D2- Define and Describe the problem
- Specify by identifying in quantifiable terms the who, what, where, when, why, how, and how many (5W2H)
- 5 Why or Repeated Why (Inductive tool)
- Problem Statement
- Affinity Diagram (Deductive tool)
- Fishbone/Ishikawa Diagram (Deductive tool)
- Is / Is Not (Inductive tool)
- Problem Description
- D3- Develop interim containment plan
- Implement Interim Containment Actions (ICA)
- Verification of effectiveness of the ICA is always recommended to prevent any escapes to customers
- D4- Determine, identify, and verify root causes and escape points
- Comparative Analysis listing differences and changes between “Is” and “Is Not”
- Development of Root Cause Theories based on remaining items
- 5 Whys
- C&E Diagrams
- Determine Escape Point, which is the closest point in the process where the root cause could have been found but was not
- Review Process Flow Diagram for location of the root cause
- D5- Choose Permanent Corrective Action (PCA)
- Establish the Acceptance Criteria which include Mandatory Requirements and Wants
- Perform a Risk Assessment / Failure Mode and Effects Analysis (FMEA) on the PCA choices
- Based on risk assessment, make a balanced choice for PCA
- Select control-point improvement for the Escape Point
- Verify the PCA will resolve root cause of problem and any escape points issues
- D6- Implement and Validate PCAs for problem/nonconformity
- Define and Implement the best PCAs
- Validate PCAs using objective measurement
- D7- Prevent recurrence
- Review Similar Products and Processes for problem prevention
- Develop / Update Procedures and Work Instructions for Systems Prevention
- Capture Standard Work / Practice and reuse
- Assure FMEA updates have been completed
- Assure Control Plans have been updated
- Preserve and share the knowledge, preventing problems on similar products, processes, locations or families
- D8- Congratulate your team
- Archive the 8D Documents for future reference
- Document Lessons Learned on how to make problem-solving better
- Before and After Comparison of issue
- Celebrate Successful Completion
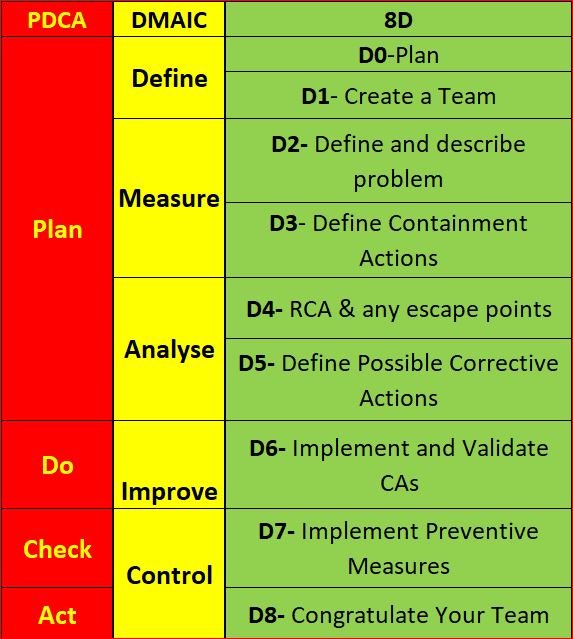
If you have interacted with a Six Sigma Team or a PDCA Root cause team, you know how the DMAIC and PDCA compares. For illustration, I have them side by side. 8D is much more broken down than the others. Using PDCA, the assumption is that a team acting in a PDCA cycle will have top management support and that those involved have the proper knowledge and training required to gather and analyze data to determine a solution. Also assumed is that the resources are available to improve the issue, Measurement of the results is always part of the cycle, and reacting to the final results of the Check on the improvement will yield either a successful CA/Improvement or begin a repeat of the cycle (basically the scientific method).
Most consider DMAIC the same as PDCA, just more focused on clarifying the PDCA cycle in order to reduce iterations by shifting the focus away from potential multiple cycles to achieving the most effective improvement the first time (though failure is still built into the process). The 8D method is once again pretty much the same process, as you can see.
When DMAIC and 8D are highly templated, a lot of the focus moves from solving the root cause toward closing the CAPA within the mandated time.
Making problem-solving quick and easy makes it easy to pencil whip. I would suggest you avoid the potential pencil whip methods. Have a group that must think for themselves and writes the report using only basic guidelines (not templates).
Conclusion
While I have clearly indicated I am not a fan of 8D and not happy with the way DMAIC is being pushed into templates, I do not mean to say that any single technique is better than another. Essentially, they are all the same method, re-focused. 8D is very conducive to utilizing documentation of project results and assigning work breakdown structure accountabilities (WBS) DMAIC is better for cross-functional communication and can be used for similar documentation. The Shewhart PDCA cycle is more of a high-level outline that allows the improvement project to be adjusted as required by SMEs. Choose the method that suits your needs, and as long as a cross-functional team performs proper due diligence with full top management support, the outcome will usually be similar regardless of the method chosen.
Processing…
Success! You're on the list.
Whoops! There was an error and we couldn't process your subscription. Please reload the page and try again.
Bibliography
ASQ. (nd). ASQ Quality Resources. Retrieved from WHAT ARE THE EIGHT DISCIPLINES (8D): WHAT ARE THE EIGHT DISCIPLINES (8D)?
Pruitt, W. F. (2019, May). A Disciplined Approach. Retrieved from ASQ Quality Progress: http://asq.org/quality-progress/2019/05/back-to-basics/a-disciplined-approach.html
Quality One. (nd). Quality One. Retrieved from Eight Disciplines of Problem Solving (8D): https://quality-one.com/8d/

Is-Is Not Matrix

REFLECTION: FOR STUDENTS: Are you focusing on root causes or symptoms when addressing problem solving?
FOR ACADEMICS: Are you providing your students with the tools needed to comprehend the true root cause of problems so they may be mitigated?
FOR PROFESSIONALS/PRACTITIONERS: Is your organization allowing you find the true root cause of an issue before forcing the issue forward? This practice will hurt the business in the long run. Try to convince top management to allow all problems to be fully explored. Using COPQ may get their attention if it is documented properly.
Overview of Is – Is Not Matrix Tool
The Is – Is Not Matrix helps to identify where to start looking for causes, especially when the root cause may be hidden by multiple factors. By isolating the who, what, when, and where of a stated problem, you can compare the “is,” and the “is not” of the problem and narrow your investigation to factors that have an impact and eliminate factors with no effect.
IS-IS NOT Matrix Process
As the name implies, you begin by drawing out a matrix, as shown here, with the problem statement in the upper left corner, clearly defining the problem in a way that allows everyone to understand the issue being addressed (Tague, 2005).
This tool works best with a cross-functional group of four to eight people who represent all facets of the issue and an active facilitator who challenges statements made, such as “Do we have data to back that up?” and “Do we know that to be true?” (Rucker, 2010).
Is
After the team has agreed upon a concise, specific Problem definition, use the “Is” column to describe what occurred or occurs. Determine what objects are affected and what precisely occurs, being as specific as possible. Determine where the event occurs- Geographically, physically (as in department), or physically where on the object (top left of the page)- It can be a combination of all of these. Next comes the determination of When the event occurs. For best resolution, the team should come to a consensus (preferably using data) on when it first happened, when since, the pattern of occurrence detected, and, did this event occur in relation to any other events (before, during, or after)?
Determine How many or How much-the extent of the problem using the team consensus and available data. Severity is a good thing to capture for the group in order to help guide future decisions.
Determine who is involved, including to whom, by whom, and near whom does this type of event occur? At all cost do not use this as an opportunity to play the blame game. Only explore cause.
Is Not
After the “Is” column has been filled out, perform the same set of evaluations used for the “Is” column on the “Is Not” column to identify the circumstances that could occur but do not, using what, where, when, how many/much (extent), and who type questions.
Evaluation
Evaluate the “Is” / ” Is Not” columns to identify distinctions and possible consequences for the differences. Try to determine what changes have occurred, recording observations in the far right column.
Distinctions and Consequences
For each Distinction or Consequence, ask, “Does this relate to a change we are aware of?’ And “How could this have caused our problem?” Record all possible causes, including what may have caused the problem and how it did so.
Testing
- Test all possible causes by asking, ‘does this explain every item in the “Is” and “Is Not” columns? The most likely causes will address every aspect of the problem.
- If possible, plan an experiment to verify the cause(s) you have identified.
When data are not available to back up a position, ask yourself whether it could be quickly collected. To separate theories from opinions, determine if you could conduct an immediate experiment as proof? Add any results obtained from testing to the matrix (Tague, 2005) (Rucker, 2010)
Basic Example

Conclusion
For the best result, always be sure the team has a the problem statement in as concise and specific language as possible in order to focus on just one issue. It is also best to describe the problem as the lowest possible level (the example of “car will not start” was not a sterling example). The more focused the more likely this tool will yield results. Maximum detail should be utilized when describing the “is” and “is not”, and never be afraid to seek more data!
Processing…
Success! You're on the list.
Whoops! There was an error and we couldn't process your subscription. Please reload the page and try again.
Bibliography
Rucker, D. M. (2010, March). ASQ Quality Progress. Retrieved from Back to Basics: http://asq.org/quality-progress/2010/03/back-to-basics/get-to-the-root-of-it.html
Tague, N. R. (2005). The Quaity Tool Box. Milwaukee: Quality Press.
