What is an A-3 Report?

REFLECTION: FOR STUDENTS: “Having no problems is the biggest problem of all.”- Taiichi Ohno
FOR ACADEMICS: “Data is of course important in manufacturing, but I place the greatest emphasis on facts.”- Taiichi Ohno
FOR PROFESSIONALS/PRACTITIONERS: “Make your workplace into showcase that can be understood by everyone at a glance.”- Taiichi Ohno
Foundation
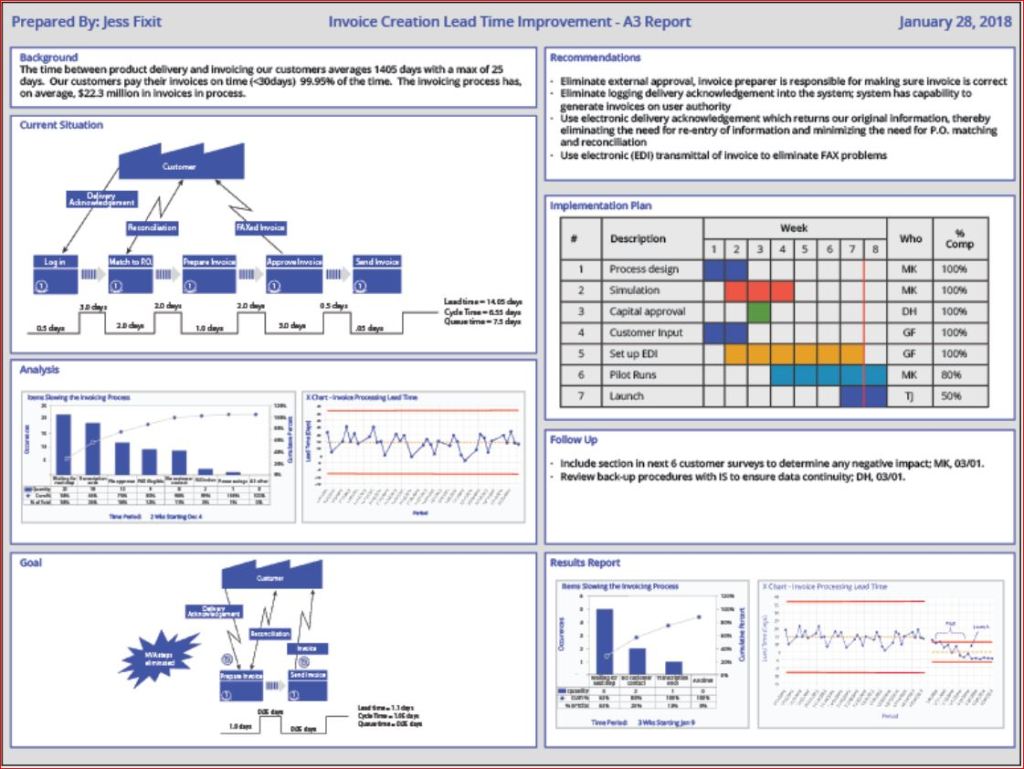
The A3 Report is a model developed and used by Toyota and currently used by many businesses around the world. The A3 Report is named for a paper size-A3 (29.7 x 42.0cm, 11.69 x 16.53 inches). The entire current state and PDCA aspects of the project are captured visually for easy communication and reference. When CIP projects use an A3 methodology to track projects, it has been demonstrated that clear visual communication helps the team members and the overall organization be more aware of the team’s progress.
A minor improvement event, in my experience, is generally four weeks to six weeks. Still, when an issue needs to be addressed thoroughly, the organization must be willing to invest more time and resources. Almost every moment of improvement time spent may be wasted if the true root cause is not adequately addressed due to failure to properly invest resources. There are four distinct phases: 1) preparation and training; 2) process mapping and current state analysis; 3) process mapping and future state analysis; and 4) implementation and ownership. I will put up a basic template below and walk through the A3 report.
Example

- Clarify the Problem
- IS/IS Not Analysis-excellent first tool to use to define the scope of the problem.
- After the scope of the problem has been defined, define the problem relative to the organization or process. The focus should always be on an underlying process or systematic issue, not an individual failure. Systematic failures are frequent but can be corrected with teamwork. The problem statement should never include a suggestion for a solution.
- Breakdown the Problem
- Clearly define the problem in terms of the 5 Why’s and 2 W’s (Who?, What?, When?, Where?, Why? And How?, How much or often?
- Set goals for improvement towards the ideal state vs current state
- Team sets S.M.A.R.T. goals relevant to block 1 state, establishing the end improvement target
- Root Cause Analysis
- Team uses focus areas from block 2 to determine Root Cause(s) employing relevant RCA tools
- Common RCA tools
- Cause-Effect/Fishbone Diagram
- 5 Why Analysis
- Fault Tree Analysis
- Pareto Chart
- Clearly state the determined root cause(s) and display the output of the tools
- Develop Countermeasures
- The team should take the root cause/causes from Block 4 and assign specific countermeasures.
- Countermeasures should directly address the root cause and, in theory, should solve the problem identified in Block 1.
- The completed fifth block is populated with any tool that will outline the countermeasures.
- Implement Countermeasures
- The team tracks the countermeasures from Block 5 and ensures each one is accomplished.
- The completed sixth block should be populated with the tool used in Block 5 to outline the countermeasures and updated as each is accomplished.
- Monitor Results and Process
- Effectiveness Check of Countermeasures
- Before/After Analysis
- SPC Control Charts
- Use Data from block 1 to determine if countermeasures from block 5 are having the desired effect relative to the target.
- If countermeasures are not effective, go back to RCA-block 4 (PDCA) and reconvene.
- Use the tool from block 6 to track countermeasure as ineffective in Block 7
- Effectiveness Check of Countermeasures
- Standardize successful processes
- If countermeasures are effective-
- Standardize all successful processes and note successful countermeasures as Standardized as they are approved using the tool from block 6 in Block 7
- A separate block can be used for Standardized processes
- If countermeasures are effective-
Conclusion
A complete A3 report can use many different tools, depending upon the problem being examined, so don’t fall into the habit of always using the exact same format. Be certain all four phases are completed. Innovation comes from creativity, so leave behind SOPs that demand exact clones of past reports. You may be dealing with a problem no person in your organization has yet to encounter, so outside of the box is thinking should always be on the table (Not locked away in a closed mind)

Processing…
Success! You're on the list.
Whoops! There was an error and we couldn't process your subscription. Please reload the page and try again.


Bibliography
Quality Management Journal, Volume 16, 2009 – Issue 4
Published Online: 21 Nov 2017
Quality Progress Volume 49, 2009 – Issue 1
Jan 2016
Six Common Weaknesses With Teams

REFLECTION: FOR STUDENTS: “If two men on the same job agree all the time, then one is useless. If they disagree all the time, both are useless.” —Darryl F. Zanuck
FOR ACADEMICS: “If you have built castles in the air, your work need not be lost; that is where they should be. Now put the foundations under them.” —Henry David Thoreau
FOR PROFESSIONALS/PRACTITIONERS: “Don’t be afraid to give up the good to go for the great.” —John D. Rockefeller
Foundation
Teams and teamwork are much more a part of Quality and general business culture than a generation ago. The lone wolf “I’ve got this” type is almost extinct- but they are still highly useful due to being productive and often individually creative. I will not make this discussion about individual vs. team performance. The focus of this post will be to highlight some of the common failings in team dynamics (internal and external forces included), to help raise awareness. Too often, a team has become a “magic wand” used to fix a problem, and the team leader may have to drag a lot of that weight if the team does not properly understand how each moving part has to function for full success. When each part of the team has full accountability, the members are much more invested, and the team overall improved.
Team Weaknesses
- Team goals can become misaligned with the goals of the organization
- When teams and/or their decisions are not accepted and supported by management, the efforts of the team are wasted
- Time is needed to build and maintain high-performance teams
- Decision making is typically slower using a team because of the time it takes to make a decision by consensus
- Teams can also create negative synergy, where time is wasted simply because of the effort it takes to work with other people, or because teams get distracted with off-task activities, including social interactions
- Teams can be impacted by “group think”, in which the desire for harmony or conformity in the team results in lack of diversity of thought, shutting down of alternative points of view, and dysfunctional decision making
(WestFall, 2016)
Discussion
The first weakness (more often known as lack of strategic alignment) can make the team feel like they are accomplishing something, only to be informed mid-project or post-project that the overarching organization has a different goal. I would not count that so much as a team weakness, but more as a common communication failure between Management and teams.
Lack of Top Management support is a severe moral dampener to any team. Even if a team is successful despite lack of support, Implementation may not occur when Management offers no support.
Time is money, and because it takes time to build a good team, it drains financial resources. The time required to be dedicated to maintaining teams often pulls focus from day-to-day activities. Tasks required by Teams for special operations should never overwhelm the day to day work of standard operations.
Team Decision Making- Most teams have hit the wall of being unable to reach a consensus. This natural weakness can be overcome by using techniques like multivoting or Nominal Group Technique especially with a facilitator.
Negative Synergy is a common issue and can be well addressed with team self-discipline, a diligent and attentive facilitator, or a combination of both as required.
“Group Think” is one of the worst enemies of effective teams. No member of the team should fear to put forth a dissenting opinion. When a team is open to being questioned, the team is actively practicing critical thinking. One of the ways teams can avoid the phenomenon of “Group Think” is by creating ground rules that require objective data to be presented to make a decision. I would caution, though, that statistics can be twisted to look pleasing to your personal view, so each team member should be just as responsible for confirming the stats on their own after a presentation.
Conclusion
Potential team weaknesses should be considered when evaluating Project Risks. The ability to mitigate those risks as a team will help the team be a more cohesive unit.
Processing…
Success! You're on the list.
Whoops! There was an error and we couldn't process your subscription. Please reload the page and try again.
Bibliography
WestFall, L. (2016). The Certified Software Quality Engineer Handbook 2nd Edition. Milwaukee, WI: ASQ Quality Press.
Leadership From the Viewpoint of Motivation

REFLECTION: FOR STUDENTS: “Nothing in the world can take the place of perseverance. Talent will not; nothing is more common than unsuccessful people with talent. Genius will not; unrewarded genius is almost legendary. Education will not; the world is full of educated derelicts. Perseverance and determination alone are omnipotent.”
Calvin Coolidge
FOR ACADEMICS: “Motivation is a fire from within. If someone else tries to light that fire under you, chances are it will burn very briefly.”
Stephen R. Covey
FOR PROFESSIONALS/PRACTITIONERS: “People rarely succeed unless they have fun in what they are doing.”
Dale Carnegie
Foundation
The best leaders understand two key things: The nature of Motivation and the nature and consequences of Self-Betrayal. First, a Leader must realize how one person cannot motivate another. The feeling of motivation is brought about by creating an environment where the person feels comfortable and motivated. There are two categories of motivation: Extrinsic and Intrinsic.
Extrinsic Motivation– The satisfaction gained from material or psychological needs applied by others in the organization through incentive or reward.
Intrinsic Motivation- The qualities of work or of relationships, events, or situations that satisfy basic psychological needs (achievement, power, affiliation, autonomy, responsibility, creativity, and self-actualization) in a self-rewarding process. (Russell T. Westcott, 2014)
The concept of Self-Betrayal is a bit more abstract but inherent in all human beings. An act of Self-Betrayal is an act contrary to what you feel you should do for another person (or even for the organization). (The Arbinger Institute, 2010)
What a Leader Needs to Know about Self-Betrayal
The best way to categorize the behaviors and attitudes that lead to acts of Self-Betrayal is In the Box and Out of the Box. Out of the Box means you see yourself and others more or less as we are- as People or Entities. When you are In the Box, you see yourself and others in a systematically distorted way-Others are mere objects. Existing in the Box can create barriers to effectiveness in change, coping, communicating, implementing new skills, or even changing your behavior.
What Follows Acts of Self Betrayal

- You begin to see the world in a way that justifies the self-betrayal
- Self-Justification (without objective evidence) leads to a distorted view of reality
- You enter The Box
- Over time, individual boxes become characteristics of you, and you carry them with you
- By being in the Box, you provoke others to enter their Box
Getting out of your Box as a leader is essential to leading others out of their Boxes. Being in the Box is not a passive act. Being in the Box is actively resisting what your humanity is calling you to do. While in the Box, you are assigning blame to people rather than trying to help improve. The blame game serves no useful purpose.
Once you stop resisting your natural tendencies and honor your original commitment to do what is best for the person beside you or what is best for the company, most of the barriers will evaporate. (The Arbinger Institute, 2010)
Conclusion
A good leader cannot push “followers”. The very term follower precludes the concept of pushing, so others must be motivated from within, either Intrinsically (just from the internal reward) or driven from within by the feeling that comes with an external incentive or reward (Extrinsically). Culture and the interconnectedness of the organization are essential. Remove yourself from the Box and connect with all others on a human level, or you as a leader will become just an object to your followers, and your followers will begin to seem distorted objects as well. If the entire culture is built upon a distorted reality, nobody will see the organization as a living entity worthy of serving. The organization will morph into an object to be used and abused. Lead your employees and your organization out of the Box, and lead towards a culture that is value-added for all stakeholders.
Processing…
Success! You're on the list.
Whoops! There was an error and we couldn't process your subscription. Please reload the page and try again.
Bibliography
Russell T. Westcott. (2014). The Certified Manager of Quality/Organizational Excellence. Milwaukee, WI: ASQ Quality Press.
The Arbinger Institute. (2010). Leadership and Self-Deception. San Francisco: Berrett-Koehler Publishers, Inc.
10 Common Team Process Problems-And Their Solutions

REFLECTION: FOR STUDENTS: “Alone we can do so little; together we can do so much.” – Helen Keller
FOR ACADEMICS: “If I have seen further, it is by standing on the shoulders of giants.” – Isaac Newton
FOR PROFESSIONALS/PRACTITIONERS: “No one can whistle a symphony. It takes a whole orchestra to play it.” – H.E. Luccock
Foundation
Issues with successful Teambuilding and team project execution about in the Quality and Management world, so I will give a quick overview of 10 of the most common team process problems, as well as potential solutions to those problems. Good Team Dynamics has a direct correlation with Team productivity and success, so take problem-solving down to the team dynamics level if you want your teams to thrive.
The ten problems I will discuss-
- Floundering (Failure to Launch or Close)
- Team members using title or authority to influence the team process flow (stealing empowerment)
- Team members who talk too much (making other viewpoints hard to voice)
- Team members who don’t participate enough (leaving potentially valuable input in their heads)
- Blind acceptance of opinions as facts, or team members making opinions sound like facts.
- Rushing to a solution or conclusion before a team has conducted the full problem-solving process
- Damaging Team Dynamics by attempting to explain other members’ motives
- Team members ignoring or ridiculing one another’s values statements made
- Team constantly drifts off the main Agenda and spends too much time on unfocused conversation.
- Conflict involving personal matters
Solving any of these issues begins with three critical items. First, the team must have a clear written Charter to avoid any disagreement about the actual problem, scope, objectives, and timeline currently on the table. Second, the first meeting should establish meeting ground rules for conduct that can be updated as a group as required. Third, it is best to include a member of the team who’s role is Facilitator. The Facilitator’s purpose is not to become involved in the content of the meeting, but to act to help the team avoid slow progress (or roadblocks) during difficult situations and act as a catalyst for the team while evaluating the team objectives and progress. (Russell T. Westcott, 2014)
The Solutions-
The solutions below are not the only solutions or necessarily the best, just examples of overcoming a problem.
- Floundering- The Team Leader or Facilitator should use the Charter to redirect the team to the recorded objectives.
- Team Member(s) Using Organizational Influence to Influence Team Process- Talk to the member or members attempting to use their power to influence the team off-line. Be certain to clarify the impact of their organizational role and how it may affect the team. Highlight the need for consensus, not agreement out of fear team members might feel repercussions for offering dissenting opinions. Ask for cooperation and patience.
- Team Members talk too much- Practice a form of Gatekeeping that structures the meetings in a way that requires the entire team to write down their opinion on a topic of discussion. Then the individual views are discussed as a group one opinion at a time. The “talking stick” technique works well also.
- Team Member reluctant to participate- Once again, a form of Gatekeeping is a good solution when members will not speak up. Lack of input from shyness or intimidation can deprive the team of useful information, so asking each member of the team to speak on the issue will encourage conversation. Direct assignments with the need to report on actions and progress with help foster involvement as well.
- Blind acceptance of opinions as facts- The best solution to this is to respectfully challenge a view being presented as fact by asking for the supporting data.
- Rushing- Remind your Team of the cost (in terms of dollars and lost time) of jumping to the wrong conclusions. Dollars and time carry a lot of weight in decision making.
- Attempting to explain other members’ motives- Avoid pointing fingers; turn to the person who has had their motives explained, and ask, “would you please clarify that for the team” so that motives do not become accusations. If it becomes a consistent issue, take the offender off-line and ask them to stick to the problems and objective evidence. Adding a Conduct rule is possible if there are team dynamics issues (especially when your pool of team members is small).
- Ignoring or ridiculing one another’s values or statements made- Listening and understanding should be emphasized to the team. The Team Lead and Facilitator should support the Discounted person or persons. Remind everyone that some ideas seem crazy until they succeed.
- Digression/tangents- Remind members of the agenda and time estimates. This problem is where a Facilitator is most helpful. Always move the meeting back on track, reminding the Team of the current mission, objectives, and norms established.
- Conflict-Take real conflict off-line and Reinforce ground rules of conduct.
(Russell T. Westcott, 2014)
Conclusion
These problems within a Team should never be solved with generic solutions, and each team will have such a unique perspective that only your team can answer these problems for you. Still, it must be your team together that solves your internal team process problems, or the main issue your team is facing will continue to go unsolved or ineffectively solved.
Processing…
Success! You're on the list.
Whoops! There was an error and we couldn't process your subscription. Please reload the page and try again.
Bibliography
Russell T. Westcott. (2014). The Certified Manager of Quality/Organizational Excellence. Milwaukee, WI: ASQ Quality Press.
How Do You Define Good Leadership?

REFLECTION: FOR STUDENTS:
“The challenge of leadership is to be strong, but not rude; be kind, but not weak; be bold, but not bully; be thoughtful, but not lazy; be humble, but not timid; be proud, but not arrogant; have humor, but without folly.”
— Jim Rohn, entrepreneur and motivational speaker
FOR ACADEMICS:
“A leader is best when people barely know he exists…when his work is done, his aim fulfilled, they will all say: We did it ourselves.”
— Lao-Tzu, an ancient philosopher and founder of Taoism
FOR PROFESSIONALS/PRACTITIONERS:
“A true leader has the confidence to stand alone, the courage to make tough decisions, and the compassion to listen to the needs of others.”
— General Douglas MacArthur
Foundation
I have seen Leadership defined in many ways. One who inspires or influences is a Leader to some. Others see a person who sets an example worthy of following as a Leader. In the Quality world, Leadership is paramount. The Leadership of Quality teams, Major Projects, and Cross-Functional teams are usual functions as a QE or QM. Effective Leadership is a highly complex responsibility. Unfortunately, there is no simple recipe for executing Leadership. Because those you lead will be at varying levels of maturity, this can throw some leaders off. Those leaders who do not consider the maturity factor may not provide the needed guidance. A good leadership model is Hersey and Blanchard’s situational leadership model(Russell T. Westcott, 2014). This model focuses on three factors:
- 1.Task Behavior
- Level of work-related detail & guidance a leader must provide
- Extent to which direct action must be taken with the follower
- Relationship Behavior
- Extent of communication required with the follower
- Amount of coaching/support given a Follower
- Employee Maturity or Readiness
- The ability of follower to assume risk
- Willingness of follower to assume the task
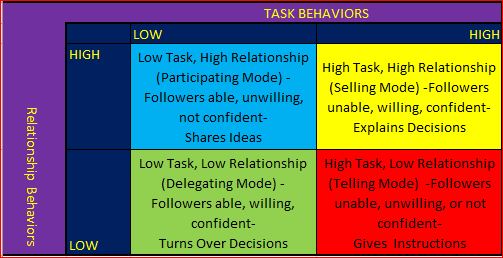
- High Task, Low Relationship (Telling Mode). In this mode of Leadership, specific instructions are given, and close supervision of performance occurs. Using the Telling Mode would be typical for a new employee until the job skill has been developed
- High Task, High Relationship (Selling Mode) This style of Leadership involves an explanation of decisions and an opportunity to clarify and ask questions as the Follower needs. At this stage, the employee has learned the necessary skills but is learning the why of the how.
- High Relationship, Low Task (Participation Mode) The Leader acts as a coach, and ideas are shared and encouragement provided. The Participation stage is the stage just before the training wheels come off.
- Low Relationship, Low Task (Delegating Mode) The leader now shifts responsibility for decisions and implementation to the employee. Successful Delegation is the culmination of a Leader doing their job effectively
(Russell T. Westcott, 2014)
Conclusion
This Model is not a guarantee of success. It is merely a tool to help guide a leader down the right path, enabling a leader to use the most appropriate mode of leadership. One style cannot fit all situations, so a Leader must adapt to the employee and the situation. An outstanding leader will re-evaluate which mode to employe each time a leader interacts one on one. The truly engaged and aware leader needs to be aware of other potential factors, such as health issues, personal/life issues, conflicts caused by co-workers damaging team dynamics, and working conditions. Leading is teaching, but refusing to move beyond the Telling Mode is only “Managing,” not Leading, and will drive good talent away over time.
Processing…
Success! You're on the list.
Whoops! There was an error and we couldn't process your subscription. Please reload the page and try again.
Bibliography
Russell T. Westcott. (2014). The Certified Manager of Quality/Organizational Excellence. Milwaukee, WI: ASQ Quality Press.
Basic QA Statistics Series (Part 6) How to Read a Box-and-Whisker Diagram

REFLECTION: FOR STUDENTS:
”Images are the most powerful communicator we have.”
– John Berger, 1926
FOR ACADEMICS:
”We live in a visual intensive society.”
– Paul Martin Lester, 2006
FOR PROFESSIONALS/PRACTITIONERS:
”There is more to visual communications therefore than simply making an image for the eyes to perceive, it has to accommodate the mind of the person being communicated to. That is to say you are not merely making something to be perceived when visually communicating, you are fundamentally making something to be thought about.”
– Aldous Huxley, 1894 –1963
Foundation
The last post promised discussion on the Box-and-Whisker Diagram (or Box Plot). Similar to the Histogram, a box plot is a graphic tool that displays the distribution of the data, but with a critical difference. The box plot shows the Quartiles (minimum, 1st, median, 3rd, and maximum) and clarifying the Interquartile Range- IQR (See the last post) using a box. The “whiskers” of the plot are the minimum and maximum.
Box plots are very useful for quick comparison of multiple sets of data, especially when the focus is on the most critical aspects of the data, or there are not enough data points in each data set to create a reliable histogram. Different Softwares will provide descriptive statistics like the mean value as well.

As you can see, box plots are excellent tools for quickly depicting variation between shifts or machines. Minitab is very effective, but most stat software (even Excel) can easily create a box plot for a presentation with minimal extra effort.
Conclusion
I will be signing off on this short intro to QA statistics, though I will eventually return with a more in-depth series after I have turned my attention back to the broader world of Quality Culture for a while. Thank you all for your enthusiasm for this subject! If you have any subject suggestions, please send them to me!
Processing…
Success! You're on the list.
Whoops! There was an error and we couldn't process your subscription. Please reload the page and try again.
Basic QA Statistics Series(Part 5)- Basic Histogram

REFLECTION: FOR STUDENTS: When that graph pops up showing you data in histogram, pay closer attention to everything the graph is conveying, because effective conveyance of data is the future
FOR ACADEMICS: Teach your students how to use visual data graphics, and correct them when they slip up. From teachers to the boardroom, being able to construct a histogram for a presentation is a vital skill for information conveyance.
FOR PROFESSIONALS/PRACTITIONERS: Excel and Minitab do the job, but always remember the underlying theory behind the graphs for when the software goes down, or you need to do it quickly without a computer.
Foundation
As Promised from the last post from this series, we will now delve a little bit into histograms. The primary purpose of a histogram is to provide a straightforward graphic representation of the distribution of data. I’m sure everyone has heard the term “a picture speaks a thousand words.” To demonstrate this, I will show you three histograms and think you will see before you read any caption which histogram looks like useful data. Sample data should appear pretty much like a bell curve to be declared “normal.”

When the “Tail” is to the left the data is left skewed- and look at that clear outlier bin

A histogram with an almost perfectly normal distribution

When the “Tail” is to the left the data is right skewed
The histogram is a quick communication of the state of the data. When you see the strong left or right skew, you must investigate the outliers and determine why you have so many.
Constructing a Histogram from your Data
To construct a histogram from a continuous variable, you need to determine the amount of data to be used. If you were researching problems with a production line, Cost would be your horizontal, split into bins, with the recommended number of bins equal to √n (n being the number of samples), and the bins having set boundaries. Fifty data points should be your minimum. Each bin will separate the data into classes based upon frequency, but the histogram will not show you the raw data, only represent the frequency distribution. I would suggest familiarizing yourself with your company’s statistical software so that everyone uniformly performs the analysis. Having the statistical guidelines per the software will save you in some auditing situations. Minitab, Excel, and many others provide straightforward access to histogram construction. (Kubiak, 2017) Most software equalize the width of the bars, but the way I have seen the width determined by hand most often is:
- Determine # of Bars to use based upon the sample size
- Sample size of 100 or less: 7-10 Bars
- Sample size of 100-200: 11-15 Bars
- Sample size of 201 or more: 13-20 Bars
- Choose # of Bars to use
- Width(W) = Overall Range of Data (R) / # of Bars(B)
- W=R/B.
- Keep adding W to the previous bar to find the lower edge of the next bar, starting from 0
(Tague, 2005)
Conclusion
Histograms are kind of like a way to count your data frequency of occurrence within set boundaries, and then show graphically how your data is distributed. Always remember that if a histogram is constructed with too many or too few bins, it can be manipulated misleadingly. Always check the numbers yourself! This tool is one of the Seven Basic Quality Tools and meant to be used to help flag issues like outliers or non-normal data. It is not something that can solve a problem on its own, but a tool that enables you to understand what the data is telling you. The next post we cover will talk about another visual stat tool- the box and whisker diagram (for any cat lovers 😊).
Processing…
Success! You're on the list.
Whoops! There was an error and we couldn't process your subscription. Please reload the page and try again.
Create Amazon Business Account
Bibliography
Kubiak, T. a. (2017). The Certified Six Sigma Black Belt Handbook Third Edition. Milwaukee: ASQ Quality Press.
Tague, N. R. (2005). The Quality Tool Box. Milwaukee: Quality Press.
Basic QA Statistics Series(Part 4)- Interquartile Range-IQR
REFLECTION: FOR STUDENTS: A good rule in organizational analysis is that no meeting of the minds is really reached until we talk of specific actions or decisions. We can talk of who is responsible for budgets, or inventory, or quality, but little is settled. It is only when we get down to the action words-measure, compute, prepare, check, endorse, recommend, approve-that we can make clear who is to do what. -Joseph M. Juran
FOR ACADEMICS: Without a standard there is no logical basis for making a decision or taking action. -Joseph M. Juran
FOR PROFESSIONALS/PRACTITIONERS: Both pure and applied science have gradually pushed further and further the requirements for accuracy and precision. However, applied science, particularly in the mass production of interchangeable parts, is even more exacting than pure science in certain matters of accuracy and precision. -Walter A. Shewhart
Foundation
When we left this small series on basic QA statistics, we had just discussed basic measures of Dispersion- Range, Variance, and Standard Deviation. As promised, we are now covering the basics of Interquartile Range (IQR for short). IQR is also a measure of dispersion, but as I’m sure you will be exposed to IQR in the future, I thought it best to give it a separate post.
The IQR range, like the other measures of dispersion, is used to measure the spread of the data points in a data set. IQR is best used with different measurements like median and total range to build a complete picture of a data set’s tendency to cluster around its mean. IQR is also a very useful tool to use to identify outliers (values abnormally far from the mean of a data set), but do not worry about the more in-depth math.
First, to Define all of the aspects of IQR
-First Quartile (Q1)- The value at which 25% of the data are less than or equal to this value (does not have to be a value in the data set).
-Second Quartile (Q2)- The value at which 50% of the data are less than or equal to this value. It is also known as the median. The second quartile or median does not have to be a value in the data set.
-Third Quartile (Q3)- This is the point at which 75% of the data are less than or equal to this value. It also does not have to be in the data set.
-Fourth Quartile (Q4)- This value is the maximum value in the data set (100% of the data are less than or equal to this value).
-Interquartile Range (IQR)- IQR is the Third Quartile minus the First Quartile and considered a measure of dispersion.
(Kubiak, 2017)
Calculating Quartiles
There are several methods for calculating quartiles, so the technique I am going to use is just what I consider the most basic without delving into any more in-depth math.
Steps:
- Order the data set from smallest to largest.
- Determine the median (reference my post: Basic QA Statistics Series(Part 2)- Basic Measures of Central Tendency and Measurement Scales).
- This determination separates the data into two sets (an upper half and lower half). This Median is Q2
- The First Quartile (Q1) is found by determining the median of the lower half of the data (not including the Median from the previous step when calculating the lower half data set median).
- Q3 is the median of the upper half of the data set, not including the value for Q1 in the top half median determination
- Q4 is the maximum in the data set.
(Kubiak, 2017)

Data Set: 22,26,24,29,25,24, 23,26,28,30,35,40,56,56,65,57,57,75,76,77,74,74,76,75,72,71,70,79,78, 1000,10,12,13,15,16,12,11,64, 65,35, 25,28, 21,44,46,55,77, 79,85,84,86,15,25,35, 101,12,25,35,65,75
Conclusion
As you can see, I stacked the data deck with a massive outlier in the data set. 1000 is far from the mean, but the IQR is not affected by this enormous outlier, as it only takes into account Q1 and Q3.
This property of IQR helps prevent outliers from convincing you the mean is just fine, when in fact, the entire system may be out of whack but compensated for by outliers in your data. The little chart you see is called a Box and Whisker plot, and we will give it a separate post later after we discuss Histograms in the nest post.
Processing…
Success! You're on the list.
Whoops! There was an error and we couldn't process your subscription. Please reload the page and try again.
Create Amazon Business Account
Bibliography
Kubiak, T. a. (2017). The Certified Six Sigma Black Belt Handbook Third Edition. Milwaukee: ASQ Quality Press.
Contingency Planning- What Has Covid-19 Taught Us?

REFLECTION: FOR STUDENTS: Would you choose a college that could lose all service to you at any time? In the future, customers will be much more aware of supply chain impact on the customer, and past failures of supply chain maintenance.
FOR ACADEMICS: Covid-19 probably upended a lot of traditional models, though some may have been ahead of the game. Moving “Virtual Communication” from a side note to a centerpiece of future educational models will help traditional students integrate better, and understand virtual communication is not a fad, but an essential tool.
FOR PROFESSIONALS/PRACTITIONERS: Supply Chain and Management sometimes seek the cheapest vendors, to the point of shuttering internal production capability. Quality, as part of the APQP process should always present the risks of cheaper vendors and demand all possible failure modes have been mitigated before accepting the cheapest vendor. Supply chain should try to avoid committing to just one vendor because if you do not have the option to drop a vendor, the vendor holds the negotiation power.
Contingency Planning
ISO 9001-2015 8.2.1 e) includes the statement required: “establishing specific requirements for contingency actions, when relevant.”
A Contingency Plan is by definition, simple to craft. Yet effectively implementing a standing contingency plan requires you to have confidence the plan will be simple to follow and efficient. A contingency is simply a plan of action for when something goes wrong.
The contingency plan can be on a catastrophic scale like “what if a tornado hits us and disables production,” or a more common contingency plans can scale down and address individual machines, “what machine takes up the slack if machine x needs unscheduled maintenance?”. For maximum protection of your business, suppliers, and customers, all possible risks should be accounted for regardless of the probability. If the plan of action is in place, time is saved in deciding the next course of action.
Many ISO 9001-2015 certified companies have been certified for several years, yet only a handful of those companies had Pandemic Contingency Plans in place to adequately protect the supply chain. Businesses that had few or zero domestic suppliers/potential suppliers for essential goods were thinking along short term financial lines. Businesses concerned for continuity were concerned about their customers.
If every potential supplier of essential items for a pandemic had a robust and effective contingency plan in place, planning for a worst-case pandemic, the supply chain strain would have been much less severe. Hopefully, one of the lessons consistent “cut the costs” mentality bureaucrats will learn from the result of not planning for a risk (even when that risk is highly unlikely) is that having the mechanisms in place to save a business is worth the investment and the maintenance costs.
One of my old bosses made a contingency plan with all the usual disaster responses planned out. There was an unusual one on the list as well- Though it was done in jest, he provided a contingency for Alien Invasion. Highly unlikely…yet he always got a laugh at audits, but as a Marine, he always looked for the most unlikely risks and prepared for them, THANKS TOM 🙂 !
Conclusion
Creation and implementation of Covid-19 type contingency efforts for businesses will NOW likely start robustly, then as those efforts become bothersome will stagnate and fall away over time and be declared low risk and not needed because they are unlikely to occur. Please take a real-life lesson learned to the boardroom if anyone should try to say setting up a robust contingency plan is too expensive or takes too much time: Lesson: pandemic planning is necessary and it will occur.
What allows contingency planning to have any real meaning is not about getting the certification by having the plan on paper, but rather, about having an effective system in place the company can verify as capable of responding to the stressors on the business and continuing to serve your customers. Never just write the plan up and let it age. Be sure it is truly implemented and verified!
Processing…
Success! You're on the list.
Whoops! There was an error and we couldn't process your subscription. Please reload the page and try again.
Basic QA Statistics Series(Part 3)- Basic Measures of Dispersion and Statistical Notation

REFLECTION: FOR STUDENTS: “It is not possible to know what you need to learn.” -Philip Crosby
FOR ACADEMICS: “Quality is the result of a carefully constructed cultural environment. It has to be the fabric of the organization, not part of the fabric.”-Philip Crosby
FOR PROFESSIONALS/PRACTITIONERS: “Quality has to be caused, not controlled.”-Philip Crosby
Foundation
Before we go further, this post will give you the basic notation for simple statistics so we can communicate more efficiently. It will also make understanding instructions from textbooks much less challenging. Please don’t give up here. These notations are just a secret code mathematicians use. If you learn it, you will begin to see that statistics is quite accessible. After the code is passed on, we will move on to the Measures of Dispersion.
Review: Part 1 and 2 covered the definition of Population, Sample, and how the terms Parameter and Statistic relate to Population and Sample, respectively. Also, we covered the concept of what data is, as well as the different kinds of data that exist, and the measurement scales used to analyze measurement data.
STATISTICAL NOTATION
Typically, capital letters and Greek letters are used to refer to population parameters, and lower-case or Roman letters are used to note sample statistics.
I will be providing information in the table below specifically for this post. As posts are added in the series, more tables will be added to address any other notations referenced in the future. This post will become the notation reference page to allow any who are new to statistical notation an easy reference.

(Kubiak, 2017)
MEASURES OF DISPERSION
There are three primary Measures of Dispersion- Range, Variance, and Standard Deviation. I will address each and explain them plainly. If you are new to statistics, I will avoid mathematics as much as possible, but alas, you will find it inescapable.
First comes RANGE. Range is probably the most well known and most easily understood. Range is simply the difference between the largest (Maximum or MAX) value and the smallest (Minimum or MIN) value in a data set.
Example: 24, 36, 54, 89, 12, 14, 44, 55, 75, 86
Min 12, Max, 89
Range (R)= Max-Min = 77
Though Range is easy to use, it is not always as useful as the other measures of dispersion, because sometimes two separate data sets can have very similar ranges, with the other measures looking nothing alike. On that note, comes something a bit more complicated.
At first, it sounds pretty simple:
VARIANCE- This is the measure of how far off the data values are from the mean over-all. Obtaining this measurement by hand can be painful. You have to find the difference between the mean and each data point in the population or sample, square the differences, and then find the average of those squared differences.
Variance RoadMap
- Calculate the mean of all the data points Calculate the difference between the mean and each data point(Xi – μ or x ̅), Xi being a representation ith value of variable X.
- Square the calculated differences for all data points
- Add these Squared values together
- Divide that number by N if the data set is a population (N), or divide by n-1 if the data is a sample
Follow the underlined statements above, and the formula for Variance below is achieved, but most stat software will calculate Variance with minimal effort.
Sample

Population

Standard Deviation (SD)
A negative of Variance is though you can measure the relative spread of the data, it is not representative of the same scale because it has been squared. For example- data collected in inches or seconds and then checked for variance is effectively square inches or seconds squared.
Standard Deviation is more useful because the units of Standard Deviation end up on the same scale and are directly comparable to the mean of the population or sample. Standard Deviation is the Square Root of the Variance and can be described as the average distance from each data point to the mean. The lower the SD, the less spread out the data is. The larger the spread of data, the higher the SD. Once again, most Stats programs and calculators will provide SD with no problem. The SD helps you understand how much your data is varying from the mean.
Two Examples: (using sample sets)
Set 1: 35, 61, 15, 14, 1
Mean(Set 1): 25.2

Set 2: 45, 48, 50, 43, 40
Mean(Set 2): 45.2
S=√(((45-45.2)²+(48-45.2)²+(50-45.2)²+(43-45.2)²+(40-45.2)²)/4)=3.96
When you first glance at the small sample of data, set one looks like it has a much larger spread from the average than set two. When you run the numbers, the SD results back up your “gut feeling.” An analysis is always better than a “gut feeling,” no matter how intuitive you are. The larger the sample set you are looking at, the more the initial appearance of the data can mislead you, so always run those numbers!
Conclusion
To recap, Range is the most well-known and straightforward Measure of Dispersion, but only describes the dispersion of the extremes of the data, and therefore may not always provide much new information. Range is usually most useful with smaller data sets. I should also mention a term known as the Interquartile Range (IQR). I will be dedicating a separate post to IQR next post.
Variance is an overall measure of the variation occurring around the mean using the Sum of Squares methodology. Remember, variance does not relate directly to the mean, so you cannot evaluate a variance number directly, so you should use variance to see how individual numbers relate to each other within a data set. Outliers (data points far from the mean) gain added significance with variance as well. Standard Deviation tends to be the most useful Measure of Dispersion, as it relates directly to the mean, and can be used to compare the spreads of various data sets. Remember, your stats programs will help you, and many online resources will walk you through any calculation. If you have any questions, shoot me a comment, and I will answer it for you. See you next time as we dig a bit deeper into IQR. 😊
Processing…
Success! You're on the list.
Whoops! There was an error and we couldn't process your subscription. Please reload the page and try again.
Create Amazon Business Account
Bibliography
Kubiak, T. a. (2017). The Certified Six Sigma Black Belt Handbook Third Edition. Milwaukee: ASQ Quality Press.
